
Practice Free DP-600 Exam Online Questions
HOTSPOT
You have a Fabric tenant.
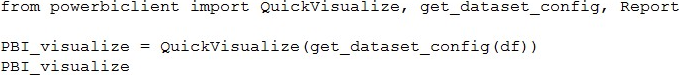
You plan to create a Fabric notebook that will use Spark DataFrames to generate Microsoft Power BI visuals.
You run the following code.
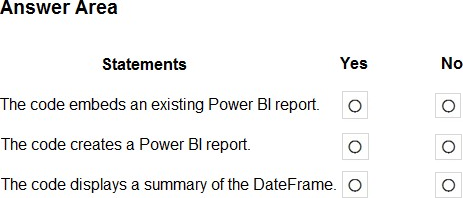
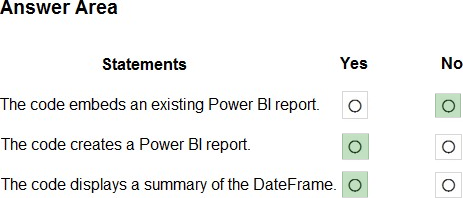
For each of the following statements, select Yes if the statement is true. Otherwise, select No. NOTE: Each correct selection is worth one point.
Explanation:
Box 1: No
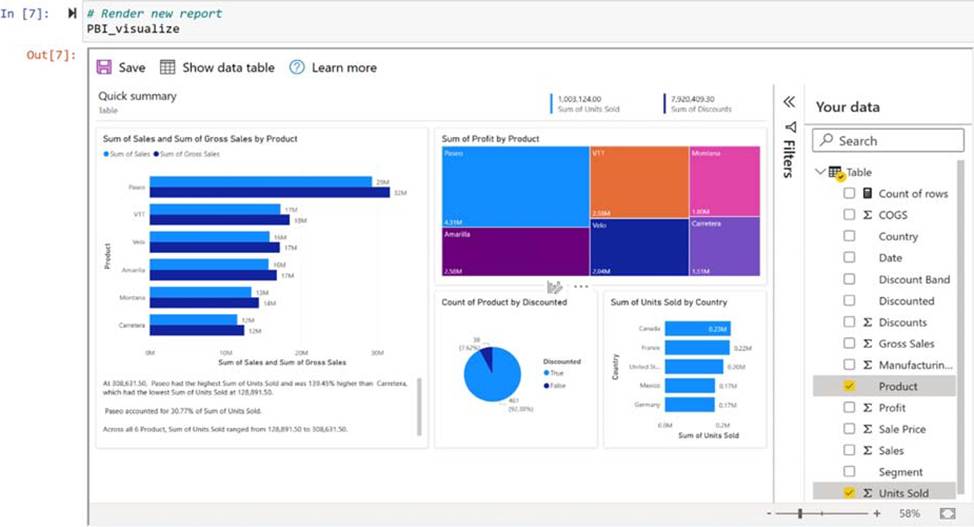
Create and render a quick visualize instance
Create a QuickVisualize instance from the DataFrame you created. If you’re using a pandas DataFrame, you can use our utility function as shown in the following code snippet to create the report. If you’re using a DataFrame other than pandas, parse the data yourself.
# Create a Power BI report from your data
PBI_visualize = QuickVisualize(get_dataset_config(df), auth=device_auth)
# Render new report PBI_visualize
Box 2: Yes
Box 3: Yes
Reference: https://learn.microsoft.com/en-us/power-bi/create-reports/jupyter-quick-report
Note: This question is part of a series of questions that present the same scenario. Each question in the series contains a unique solution that might meet the stated goals. Some question sets might have more than one correct solution, while others might not have a correct solution.
After you answer a question in this section, you will NOT be able to return to it. As a result, these questions will not appear in the review screen.
You have a Fabric tenant that contains a semantic model named Model1.
You discover that the following query performs slowly against Model1.
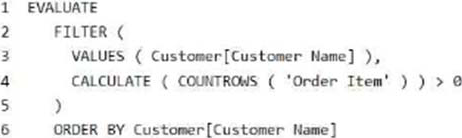
You need to reduce the execution time of the query.
Solution: You replace line 4 by using the following code:
ISEMPTY (RELATEDTABLE (‘Order Item’))
Does this meet the goal?
- A . Yes
- B . No
B
Explanation:
Correct: NOT ISEMPTY (CALCULATETABLE (‘Order Item ‘))
Just check if it is empty or not.
Note: ISEMPTY
Checks if a table is empty.
Syntax
ISEMPTY(<table_expression>)
Parameters
table_expression – A table reference or a DAX expression that returns a table.
Return value – True if the table is empty (has no rows), if else, False.
Incorrect:
* CALCULATE (COUNTROWS (‘Order Item’)) >= 0
* ISEMPTY (RELATEDTABLE (‘Order Item’))
Reference: https://learn.microsoft.com/en-us/dax/isempty-function-dax
You are the administrator of a Fabric workspace that contains a lakehouse named Lakehouse1.
Lakehouse1 contains the following tables:
– Table1: A Delta table created by using a shortcut
– Table2: An external table created by using Spark
– Table3: A managed table
You plan to connect to Lakehouse1 by using its SQL endpoint.
What will you be able to do after connecting to Lakehouse1?
- A . Read Table3.
- B . Update the data Table3.
- C . Read Table2.
- D . Update the data in Table1.
You have a Fabric tenant.
You plan to create a data pipeline named Pipeline1. Pipeline1 will include two activities that will execute in sequence.
You need to ensure that a failure of the first activity will NOT block the second activity.
Which conditional path should you configure between the first activity and the second activity?
- A . Upon Failure
- B . Upon Completion
- C . Upon Skip
- D . Upon Success
B
Explanation:
Conditional paths
Azure Data Factory and Synapse Pipeline orchestration allows conditional logic and enables the user to take a different path based upon outcomes of a previous activity. Using different paths allow users to build robust pipelines and incorporates error handling in ETL/ELT logic. In total, we allow four conditional paths.
* Upon Success
(Default Pass) Execute this path if the current activity succeeded
* Upon Failure
Execute this path if the current activity failed
*-> Upon Completion
Execute this path after the current activity completed, regardless if it succeeded or not
* Upon Skip
Execute this path if the activity itself didn’t run
You may add multiple branches following an activity, with one exception: Upon Completion path can’t coexist with either Upon Success or Upon Failure path. For each pipeline run, at most one path is activated, based on the execution outcome of the activity.
Reference: https://learn.microsoft.com/en-us/azure/data-factory/tutorial-pipeline-failure-error-handling
You have a Fabric tenant that contains a semantic model.
You need to prevent report creators from populating visuals by using implicit measures.
What are two tools that you can use to achieve the goal? Each correct answer presents a complete solution. NOTE: Each correct answer is worth one point.
- A . Microsoft Power BI Desktop
- B . Tabular Editor
- C . Microsoft SQL Server Management Studio (SSMS)
- D . DAX Studio
HOTSPOT
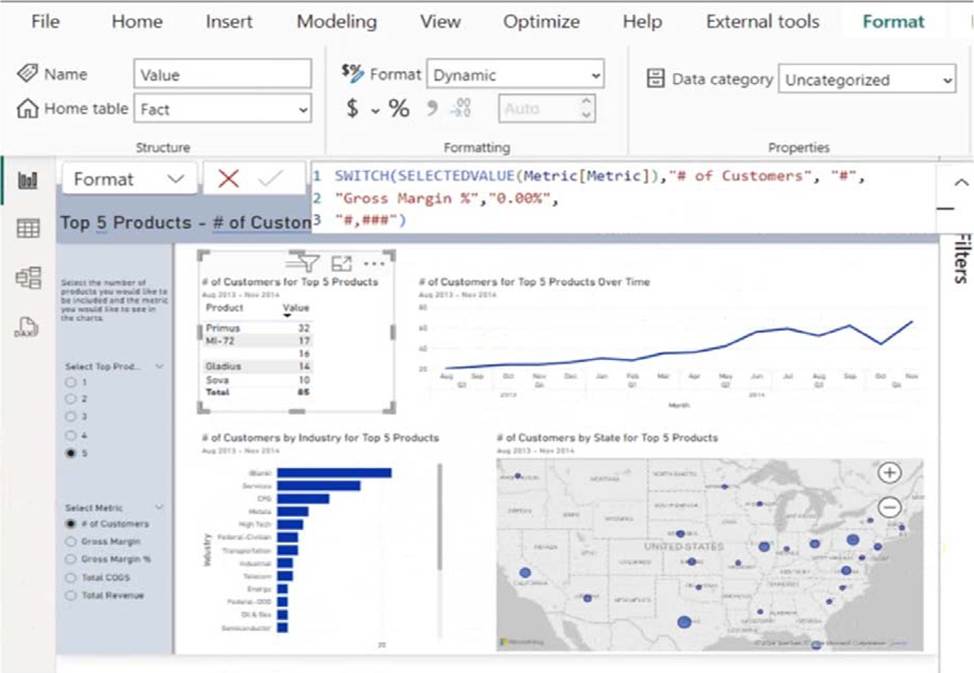
You are creating a report and a semantic model in Microsoft Power BI Desktop.
The Value measure has the expression shown in the following exhibit.
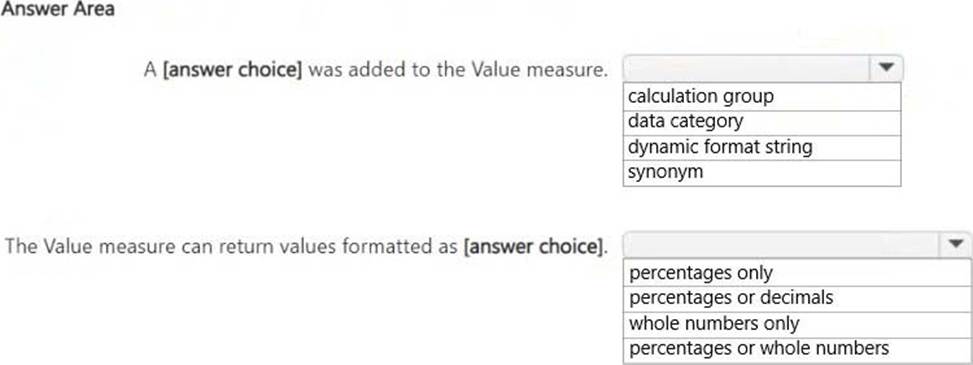
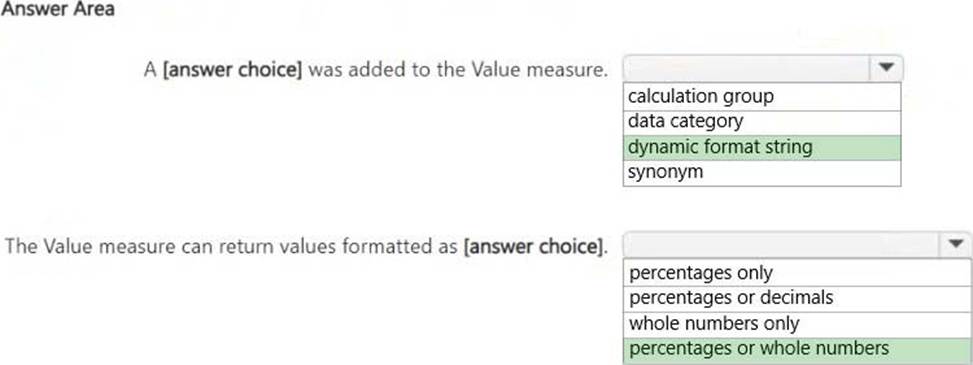
Use the drop-down menus to select the answer choice that completes each statement based on the information presented in the graphic. NOTE: Each correct selection is worth one point.
Explanation:
A dynamic format string was added to the Value measure.
The Value measure can return values formatted as percentages or whole numbers.
Dynamic Format String:
The DAX formula uses SWITCH(SELECTEDVALUE(Metric[Metric]), …)to dynamically change the format of the Value measure. This is a dynamic format string, which allows the measure to return either whole numbers (#) or percentages (0.00%), depending on the selected metric.
Formatted as Percentages or Whole Numbers:
The formula specifies that if the metric is "# of Customers", the output is formatted as a whole number (#,###). If the metric is "Gross Margin %", the output is formatted as a percentage (0.00%). Since the measure can return both whole numbers and percentages, the correct answer is "percentages or whole numbers."
HOTSPOT
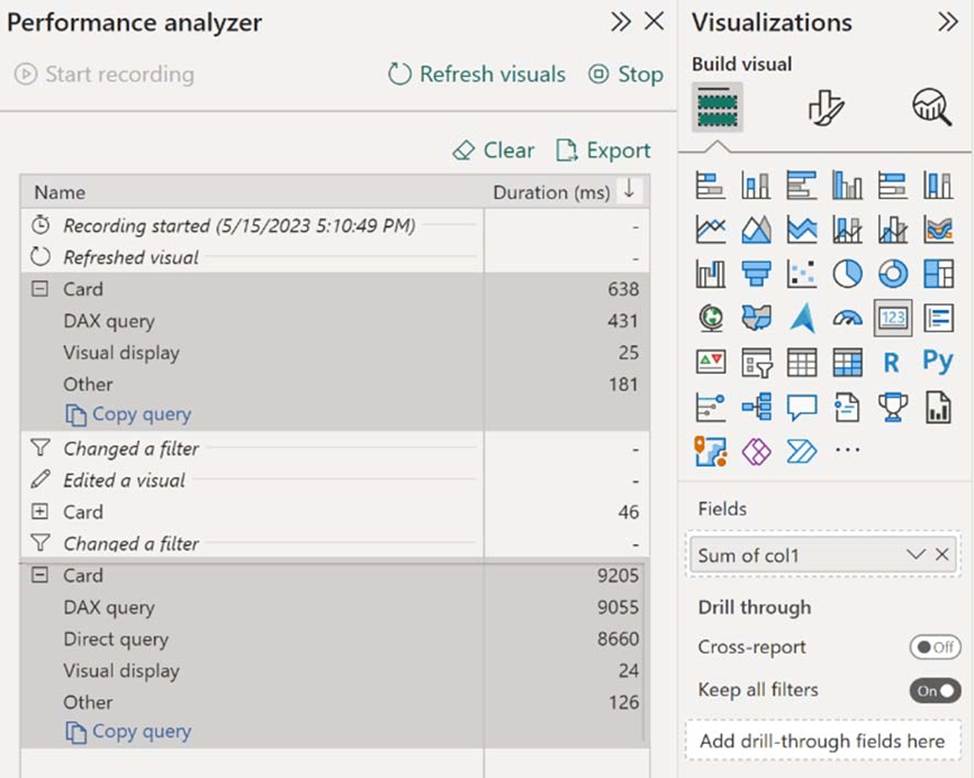
You have a Microsoft Power BI report and a semantic model that uses Direct Lake mode.
From Power BI Desktop, you open Performance analyzer as shown in the following exhibit.
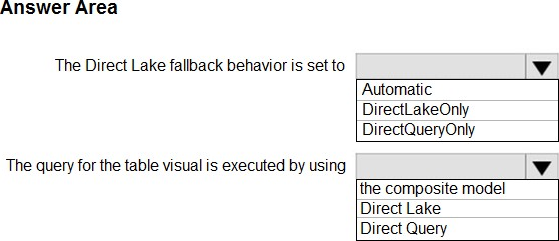
Use the drop-down menus to select the answer choice that completes each statement based on the information presented in the graphic. NOTE: Each correct selection is worth one point.
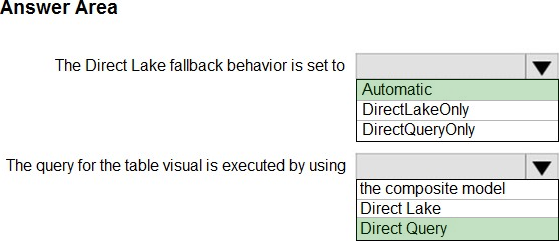
Explanation:
Box 1: Automatic
The Direct Lake fallback behavior is set to
Power BI datasets in Direct Lake mode read delta tables directly from OneLake ― unless they have to fall back to DirectQuery mode. Typical fallback reasons include memory pressures that can prevent loading of columns required to process a DAX query, and certain features at the data source might not support Direct Lake mode, like SQL views in a Warehouse. In general, Direct Lake mode provides the best DAX query performance unless a fallback to DirectQuery mode is necessary. Because fallback to DirectQuery mode can impact DAX query performance, it’s important to analyze query processing for a Direct Lake dataset to identify if and how often fallbacks occur.
Note: Fallback behavior
Direct Lake models include the DirectLakeBehavior property, which has three options:
Automatic – (Default) Specifies queries fall back to DirectQuery mode if data can’t be efficiently loaded into memory.
DirectLakeOnly – Specifies all queries use Direct Lake mode only. Fallback to DirectQuery mode is disabled. If data can’t be loaded into memory, an error is returned. Use this setting to determine if DAX queries fail to load data into memory, forcing an error to be returned.
DirectQueryOnly – Specifies all queries use DirectQuery mode only. Use this setting to test fallback performance.
Box 2: Direct Query
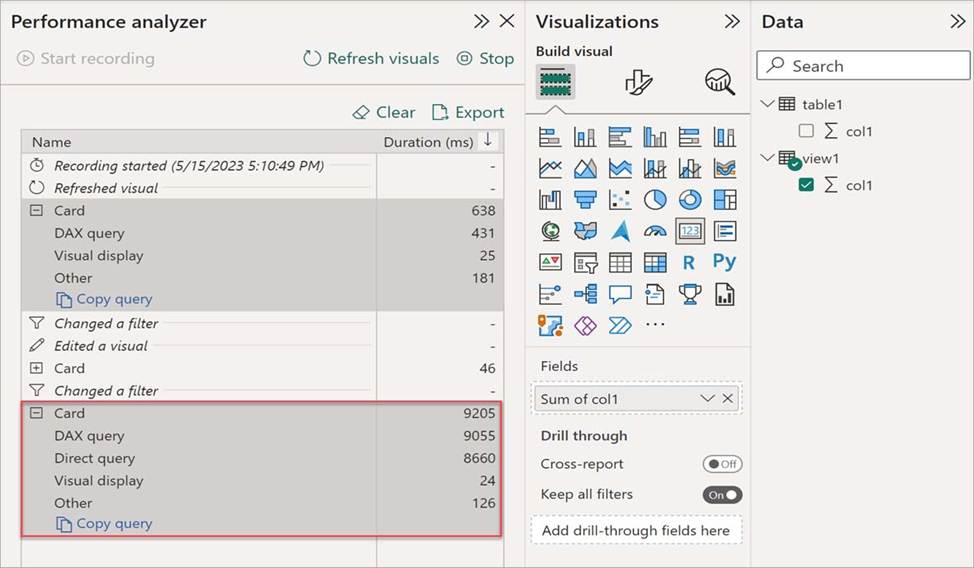
In the Performance analyzer pane, select Refresh visuals, and then expand the Card visual. The card visual doesn’t cause any DirectQuery processing, which indicates the dataset was able to process the visual’s DAX queries in Direct Lake mode.
If the dataset falls back to DirectQuery mode to process the visual’s DAX query, you see a Direct query performance metric, as shown in the following image:
Reference:
https://learn.microsoft.com/en-us/power-bi/enterprise/directlake-analyze-qp
https://learn.microsoft.com/en-us/power-bi/enterprise/directlake-overview
You have a Fabric tenant that contains a data pipeline.
You need to ensure that the pipeline runs every four hours on Mondays and Fridays.
To what should you set Repeat for the schedule?
- A . Daily
- B . By the minute
- C . Weekly
- D . Hourly
You have a Fabric tenant.
You are creating a Fabric Data Factory pipeline.
You have a stored procedure that returns the number of active customers and their average sales for the current month.
You need to add an activity that will execute the stored procedure in a warehouse. The returned values must be available to the downstream activities of the pipeline.
Which type of activity should you add?
- A . Append variable
- B . Script
- C . Stored procedure
- D . Get metadata
C
Explanation:
The Stored procedure activity in Fabric Data Factory is used to execute a stored procedure in a warehouse and capture the returned values. Since the requirement specifies that the output (active customers and average sales) must be available for downstream activities, this activity ensures the values are accessible for subsequent steps in the pipeline.
Note: This question is part of a series of questions that present the same scenario. Each question in the series contains a unique solution that might meet the stated goals. Some question sets might have more than one correct solution, while others might not have a correct solution.
After you answer a question in this section, you will NOT be able to return to it. As a result, these questions will not appear in the review screen.
You have a Fabric tenant that contains a new semantic model in OneLake.
You use a Fabric notebook to read the data into a Spark DataFrame.
You need to evaluate the data to calculate the min, max, mean, and standard deviation values for all the string and numeric columns.
Solution: You use the following PySpark expression:
df.summary()
Does this meet the goal?
- A . Yes
- B . No
A
Explanation:
Correct Solution: You use the following PySpark expression:
df.summary()
summary(*statistics)[source]
Computes specified statistics for numeric and string columns. Available statistics are: – count – mean – stddev – min – max – arbitrary approximate percentiles specified as a percentage (eg, 75%)
If no statistics are given, this function computes count, mean, stddev, min, approximate quartiles (percentiles at 25%, 50%, and 75%), and max.
Note This function is meant for exploratory data analysis, as we make no guarantee about the backward compatibility of the schema of the resulting DataFrame.
>>> df.summary().show() +——-+——————+—–+
| stddev|2.1213203435596424| null|
Incorrect:
* df.show()
* df.explain().show()
* df.explain()
explain(extended=False)[source]
Prints the (logical and physical) plans to the console for debugging purpose.
Parameters: extended C boolean, default False. If False, prints only the physical plan.
>>> df.explain()
== Physical Plan ==
Scan ExistingRDD[age#0,name#1]
>>> df.explain(True)
== Parsed Logical Plan ==
…
== Analyzed Logical Plan ==
…
== Optimized Logical Plan ==
…
== Physical Plan ==
Reference: https://spark.apache.org/docs/2.3.0/api/python/pyspark.sql.html