
Practice Free DP-600 Exam Online Questions
You have a Fabric tenant.
You are creating a Fabric Data Factory pipeline.
You have a stored procedure that returns the number of active customers and their average sales for the current month.
You need to add an activity that will execute the stored procedure in a warehouse. The returned values must be available to the downstream activities of the pipeline.
Which type of activity should you add?
- A . Get metadata
- B . Copy data
- C . Lookup
- D . Append variable
C
Explanation:
The Lookup activity is specifically designed to execute a query or stored procedure and retrieve data from a data source, such as a warehouse. It allows you to capture the output, which can then be used in subsequent activities in the pipeline.
By using the Lookup activity, you can access the returned values (number of active customers and their
average sales) and pass them on to other activities for further processing.
You have a semantic model named Model1 that contains data that relates to customers and their bank account balances.
Model1 has the following tables and columns.
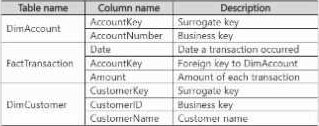
A customer can have one or more accounts. Each account can be associated to multiple customers.
You need to ensure that users can query Model1 to identify the total transaction amounts by customer.
What should you add to Model1?
- A . A many-to-many relationship between FactTransaction and DimCustomer
- B . The CustomerKey column in FactTransaction and a relationship to DimCustomer
- C . A bridge table with relationships to DimCustomer and DimAccount
- D . A bridge table with relationships to FactTransaction and DimCustomer
C
Explanation:
Scenario:
Tables:
DimAccount (accounts)
FactTransaction (transactions)
DimCustomer (customers)
Business rule:
A customer can have multiple accounts.
An account can be linked to multiple customers.
Many-to-many relationship.
Requirement: Calculate total transaction amounts by customer.
Analysis:
Direct many-to-many between FactTransaction and DimCustomer would not properly resolve aggregation.
Adding CustomerKey directly in FactTransaction is not possible because transactions link to accounts, not customers directly.
Correct approach: Create a bridge table (CustomerAccount) that maps Customer ↔ Account. Then link FactTransaction → DimAccount → Bridge → DimCustomer.
Correct Answer . C . A bridge table with relationships to DimCustomer and DimAccount
You have a Fabric tenant that contains a warehouse.
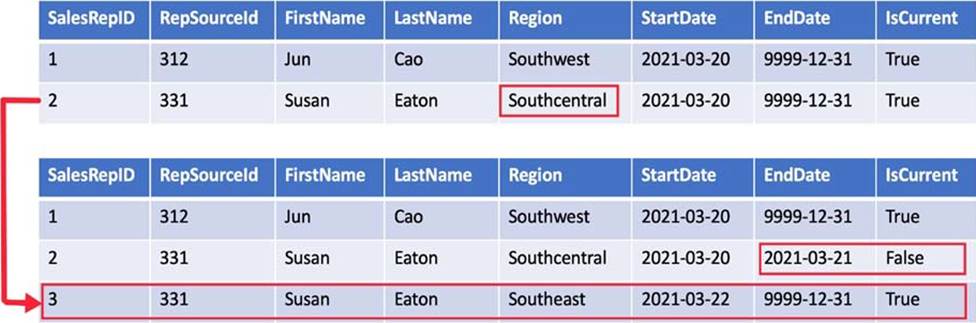
You are designing a star schema model that will contain a customer dimension. The customer dimension table will be a Type 2 slowly changing dimension (SCD).
You need to recommend which columns to add to the table. The columns must NOT already exist in the source.
Which three types of columns should you recommend? Each correct answer presents part of the solution. NOTE: Each correct answer is worth one point.
- A . a foreign key
- B . a natural key
- C . an effective end date and time
- D . a surrogate key
- E . an effective start date and time
CDE
Explanation:
Type 2 SCD
A Type 2 SCD supports versioning of dimension members. Often the source system doesn’t store versions, so the data warehouse load process detects and manages changes in a dimension table. In this case, the dimension table must use a *surrogate key* to provide a unique reference to a version of the dimension member. It also includes columns that define the date range validity of the version (for example, StartDate and EndDate) and possibly a flag column (for example, IsCurrent) to easily filter by current dimension members.
For example, Adventure Works assigns salespeople to a sales region. When a salesperson relocates region, a new version of the salesperson must be created to ensure that historical facts remain associated with the former region. To support accurate historic analysis of sales by salesperson, the dimension table must store versions of salespeople and their associated region(s). The table should also include *start and end date* values to define the time validity. Current versions may define an empty end date (or 12/31/9999), which indicates that the row is the current version. The table must also define a surrogate key because the business key (in this instance, employee ID) won’t be unique.
Reference: https://learn.microsoft.com/en-us/training/modules/populate-slowly-changing-dimensions-azure-synapse-analytics-pipelines/3-choose-between-dimension-types
DRAG DROP
You have a Fabric workspace named Workspace1.
You have three groups named Group1, Group2, and Group3.
You need to assign a workspace role to each group.
The solution must follow the principle of least privilege and meet the following requirements:
– Group1 must be able to write data to Workspace1, but be unable to add members to Workspace1.
– Group2 must be able to configure and maintain the settings of Workspace1.
– Group3 must be able to write data and add members to Workspace1, but be unable to delete Workspace1.
Which workspace role should you assign to each group? To answer, drag the appropriate roles to the correct groups. Each role may be used once, more than once, or not at all. You may need to drag the split bar between panes or scroll to view content. NOTE: Each correct selection is worth one point.
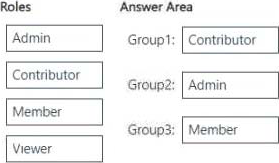
Explanation:
Group1 (Can write data but cannot add members) → Contributor
Contributors can write, edit, and manage data, but cannot manage workspace settings or add/ remove users.
Group2 (Can configure and maintain workspace settings) → Admin
Admins have full control over the workspace, including configuring settings, managing permissions, and maintaining security policies.
Group3 (Can write data and add members but cannot delete the workspace) → Member Members can add/remove members and write data, but they cannot delete the workspace or configure settings at the admin level.
DRAG DROP
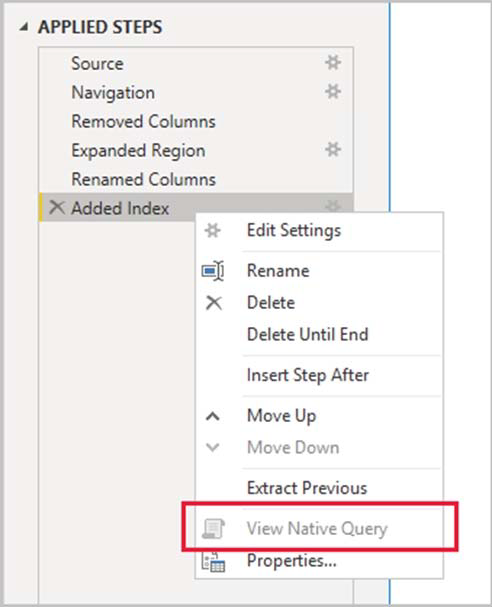
You are creating a data flow in Fabric to ingest data from an Azure SQL database by using a T-SQL statement.
You need to ensure that any foldable Power Query transformation steps are processed by the Microsoft SQL Server engine.
How should you complete the code? To answer, drag the appropriate values to the correct targets. Each value may be used once, more than once, or not at all. You may need to drag the split bar between panes or scroll to view content. NOTE: Each correct selection is worth one point.
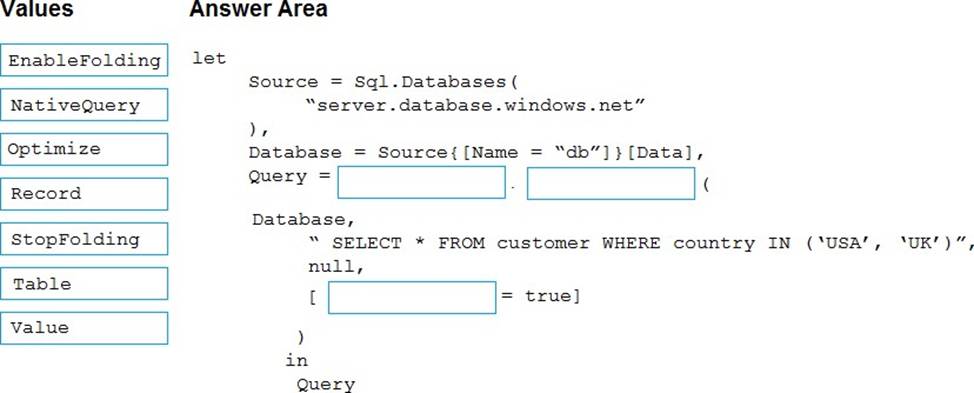
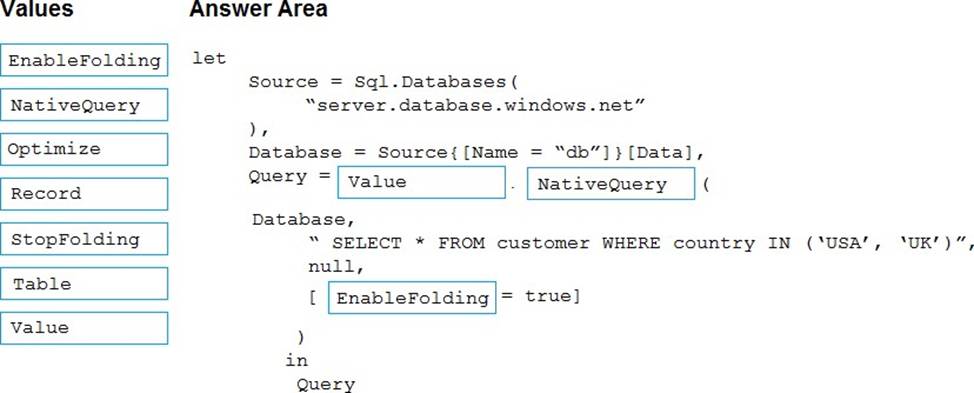
Explanation:
Box 1: Value
Query folding on native queries
Use Value.NativeQuery function
The goal of this process is to execute the following SQL code, and to apply more transformations with
Power Query that can be folded back to the source.
SELECT DepartmentID, Name FROM HumanResources.Department WHERE GroupName = ‘Research and Development’
The first step was to define the correct target, which in this case is the database where the SQL code will be run. Once a step has the correct target, you can select that step―in this case, Source in Applied Steps ―and then select the fx button in the formula bar to add a custom step. In this example, replace the Source formula with the following formula:
Value.NativeQuery(Source, "SELECT DepartmentID, Name FROM HumanResources.Department WHERE GroupName = ‘Research and Development’
Box 2: NativeQuery
Box 3: EnableFolding
The most important component of this formula is the use of the optional record for the forth parameter of the function that has the EnableFolding record field set to true.
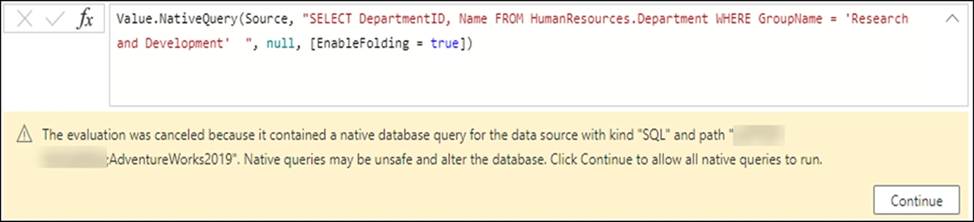
Reference: https://learn.microsoft.com/en-us/power-query/native-query-folding
HOTSPOT
You have a Fabric tenant that contains two lakehouses.
You are building a dataflow that will combine data from the lakehouses.
The applied steps from one of the queries in the dataflow is shown in the following exhibit.
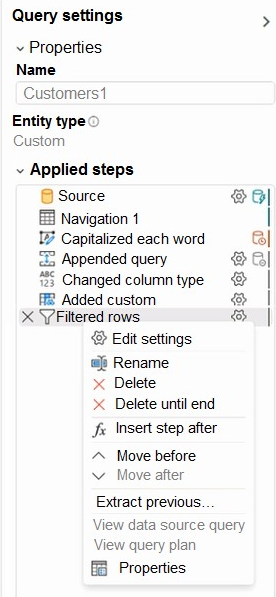
Use the drop-down menus to select the answer choice that completes each statement based on the information presented in the graphic. NOTE: Each correct selection is worth one point.
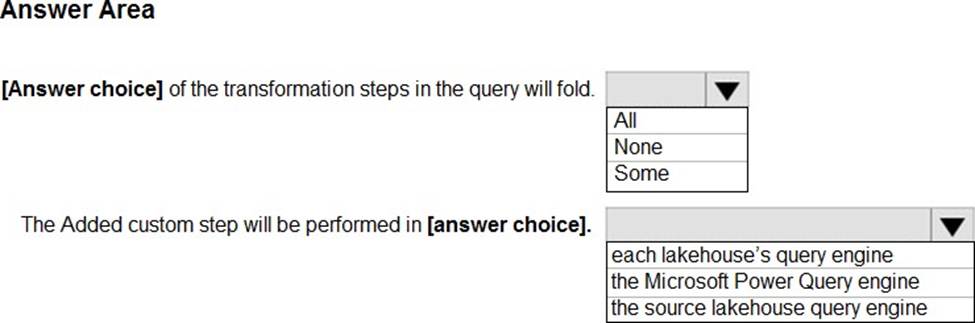
Explanation:
Box 1: Some ____ of the transformation steps in the query will fold.
We see from the exhibit that the View Native Query option isn’t enabled (greyed out).
If the View Native Query option isn’t enabled (greyed out), this is evidence that not all query steps can be folded. However, it could mean that a subset of steps can still be folded. Working backwards from the last step, you can check each step to see if the View Native Query option is enabled. If so, then you’ve learned where, in the sequence of steps, that query folding could no longer be achieved.
Box 2: the Microsoft Power Query engine
The Added custom step will be performed in ______.
Depending on how the query is structured, there could be three possible outcomes to the query folding mechanism:
-> No query folding: When the query contains transformations that can’t be translated to the native query language of your data source, either because the transformations aren’t supported or the connector doesn’t support query folding. For this case, Power Query gets the raw data from your data source and uses the Power Query engine to achieve the output you want by processing the required transforms at the Power Query engine level.
Full query folding: When all of your query transformations get pushed back to the data source and minimal processing occurs at the Power Query engine.
Partial query folding: When only a few transformations in your query, and not all, can be pushed back to the data source. In this case, only a subset of your transformations is done at your data source and the rest of your query transformations occur in the Power Query engine.
Note: Query folding is the ability for a Power Query query to generate a single query statement to retrieve and transform source data. The Power Query mashup engine strives to achieve query folding whenever possible for reasons of efficiency.
The goal of query folding is to offload or push as much of the evaluation of a query to a data source that can compute the transformations of your query.
The query folding mechanism accomplishes this goal by translating your M script to a language that can be interpreted and executed by your data source. It then pushes the evaluation to your data source and sends the result of that evaluation to Power Query.
Reference:
https://learn.microsoft.com/en-us/power-query/power-query-folding
https://learn.microsoft.com/en-us/power-query/query-folding-basics
You have a Microsoft Fabric tenant that contains a dataflow.
You are exploring a new semantic model.
From Power Query, you need to view column information as shown in the following exhibit.
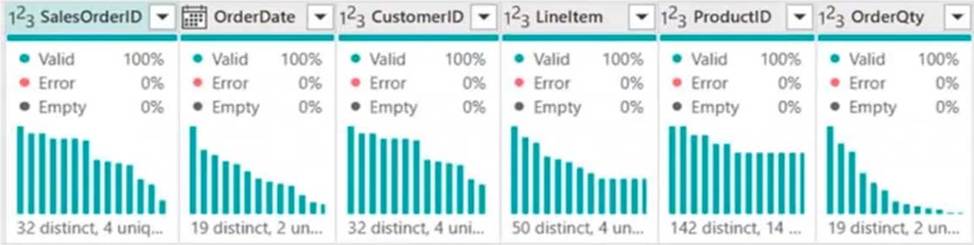
Which three Data view options should you select? Each correct answer presents part of the solution.
- A . Show column value distribution
- B . Enable details pane
- C . Enable column profile
- D . Show column quality details
- E . Show column profile in details pane
You have a Fabric tenant that contains a lakehouse named Lakehouse1.
You need to prevent new tables added to Lakehouse1 from being added automatically to the default semantic model of the lakehouse.
What should you configure?
- A . the SQL analytics endpoint settings
- B . the semantic model settings
- C . the workspace settings
- D . the Lakehouse1 settings
A
Explanation:
Default Power BI semantic models in Microsoft Fabric Sync the default Power BI semantic model
Previously we auto added all tables and views in the Warehouse to the default Power BI semantic model. Based on feedback, we have modified the default behavior to not automatically add tables and views to the default Power BI semantic model. This change will ensure the background sync will not get triggered. This will also disable some actions like "New Measure", "Create Report", "Analyze in Excel".
If you want to change this default behavior, you can:
You have a Fabric tenant that contains a complex semantic model. The model is based on a star schema and contains many tables, including a fact table named Sales.
You need to visualize a diagram of the model. The diagram must contain only the Sales table and related tables.
What should you use from Microsoft Power BI Desktop?
- A . data categories
- B . Data view
- C . Model view
- D . DAX query view
C
Explanation:
The Model view in Microsoft Power BI Desktop provides a visual representation of the relationships between tables in your semantic model. It allows you to see the structure of your star schema, including the Sales fact table and its related dimension tables. You can filter or focus on specific tables (like the Sales table and its related tables) to create a simplified view.
DRAG DROP
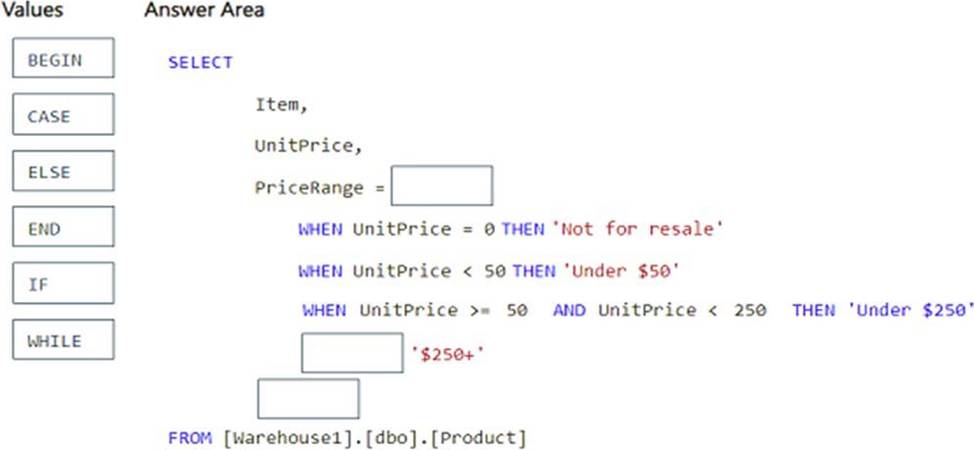
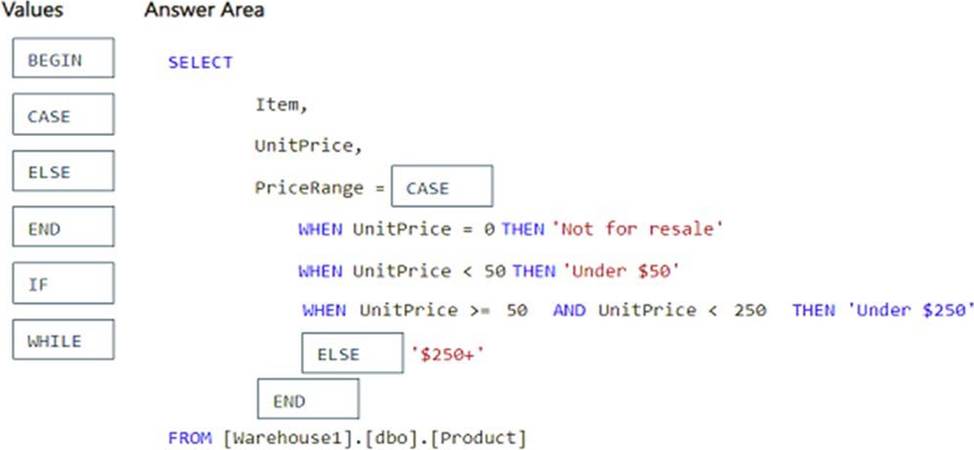
You have a Fabric warehouse named Warehouse1 that contains a table named dbo.Product.
dbo.Product contains the following columns.
You need to use a T-SQL query to add a column named PriceRange to dbo.Product. The column must categorize each product based on UnitPrice.
The solution must meet the following requirements:
– If UnitPrice is 0, PriceRange is "Not for resale".
– If UnitPrice is less than 50, PriceRange is "Under $50".
– If UnitPrice is between 50 and 250, PriceRange is "Under $250“.
– In all other instances, PriceRange is "$250+".
How should you complete the query? To answer, drag the appropriate values to the correct targets. Each value may be used once, more than once, or not at all. You may need to drag the split bar between panes or scroll to view content. NOTE: Each correct selection is worth one point.
Explanation:
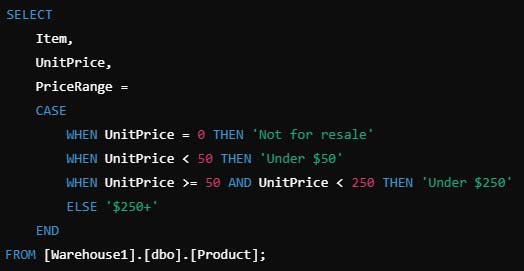
Using CASE for Conditional Logic:
– The CASE statement is used to categorize values based on conditions.
– It allows us to define multiple conditions for PriceRange based on UnitPrice.
Defining Conditions in Order of Priority:
– UnitPrice = 0 → ‘Not for resale’ (Ensuring products not for sale are labeled correctly)
– UnitPrice < 50 → ‘Under $50’ (Categorizing low-priced products)
– UnitPrice between 50 and 250 → ‘Under $250’ (Using >= 50 AND < 250 ensures the correct range)
– All other prices → ‘$250+’ (Handled by the ELSE clause)