
Practice Free DP-600 Exam Online Questions
You have a Fabric tenant that contains a complex semantic model. The model is based on a star schema and contains many tables, including a fact table named Sales.
You need to create a diagram of the model. The diagram must contain only the Sales table and related tables.
What should you use from Microsoft Power BI Desktop?
- A . data categories
- B . Data view
- C . Model view
- D . DAX query view
C
Explanation:
Model view in Power BI Desktop
Model view shows all of the tables, columns, and relationships in your model. This view can be especially helpful when your model has complex relationships between many tables.
Select the Model view icon near the side of the window to see a view of the existing model. Hover your cursor over a relationship line to show the columns used.

Reference: https://learn.microsoft.com/en-us/power-bi/transform-model/desktop-relationship-view
You have a Fabric tenant that contains a warehouse. The warehouse uses row-level security (RLS).
You create a Direct Lake semantic model that uses the Delta tables and RLS of the warehouse.
When users interact with a report built from the model, which mode will be used by the DAX queries?
- A . DirectQuery
- B . Dual
- C . Direct Lake
- D . Import
HOTSPOT
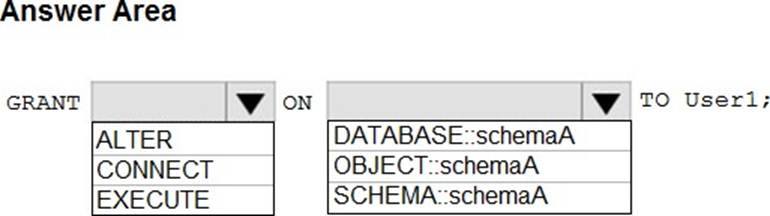
You have a Fabric tenant that contains a warehouse named Warehouse1. Warehouse1 contains three schemas named schemaA, schemaB, and schemaC.
You need to ensure that a user named User1 can truncate tables in schemaA only.
How should you complete the T-SQL statement? To answer, select the appropriate options in the answer area. NOTE: Each correct selection is worth one point.

Explanation:
Box 1: ALTER
The minimum permission required is ALTER on table_name. TRUNCATE TABLE permissions default to the table owner, members of the sysadmin fixed server role, and the db_owner and db_ddladmin fixed database roles, and are not transferable.
Using DCL:
GRANT ALTER on schema::schemaname to ‘Azure User’
Box 2: SCHEMA::schemaA
Reference: https://learn.microsoft.com/en-us/sql/t-sql/statements/truncate-table-transact-sql
https://learn.microsoft.com/en-us/answers/questions/757108/truncate-table-permission-in-azure-synapse
You have a Fabric workspace named Workspace1 that contains a lakehouse named Lakehouse1.
In Workspace1, you create a data pipeline named Pipeline1.
You have CSV files stored in an Azure Storage account.
You need to add an activity to Pipeline1 that will copy data from the CSV files to Lakehouse1. The activity must support Power Query M formula language expressions.
Which type of activity should you add?
- A . Dataflow
- B . Notebook
- C . Script
- D . Copy data
A
Explanation:
Power Query activity in Azure Data Factory
The Power Query activity allows you to build and execute Power Query mash-ups to execute data wrangling at scale in a Data Factory pipeline. You can create a new Power Query mash-up from the New resources menu option or by adding a Power Activity to your pipeline.
Translation to data flow script
To achieve scale with your Power Query activity, Azure Data Factory translates your M script into a data flow script so that you can execute your Power Query at scale using the Azure Data Factory data flow Spark environment.
Example:

Reference: https://learn.microsoft.com/en-us/azure/data-factory/control-flow-power-query-activity
You have a Fabric tenant that contains a warehouse.
You are designing a star schema model that will contain a customer dimension. The customer dimension table will be a Type 2 slowly changing dimension (SCD).
You need to recommend which columns to add to the table. The columns must NOT already exist in the source.
Which three types of columns should you recommend? Each correct answer presents part of the solution. NOTE: Each correct answer is worth one point.
- A . a foreign key
- B . a natural key
- C . an effective end date and time
- D . a surrogate key
- E . an effective start date and time
CDE
Explanation:
Type 2 SCD
A Type 2 SCD supports versioning of dimension members. Often the source system doesn’t store versions, so the data warehouse load process detects and manages changes in a dimension table. In this case, the dimension table must use a *surrogate key* to provide a unique reference to a version of the dimension member. It also includes columns that define the date range validity of the version (for example, StartDate and EndDate) and possibly a flag column (for example, IsCurrent) to easily filter by current dimension members.
For example, Adventure Works assigns salespeople to a sales region. When a salesperson relocates region, a new version of the salesperson must be created to ensure that historical facts remain associated with the former region. To support accurate historic analysis of sales by salesperson, the dimension table must store versions of salespeople and their associated region(s). The table should also include *start and end date* values to define the time validity. Current versions may define an empty end date (or 12/31/9999), which indicates that the row is the current version. The table must also define a surrogate key because the business key (in this instance, employee ID) won’t be unique.

Reference: https://learn.microsoft.com/en-us/training/modules/populate-slowly-changing-dimensions-azure-synapse-analytics-pipelines/3-choose-between-dimension-types
You have a Microsoft Power BI report named Report1 that uses a Fabric semantic model.
Users discover that Report1 renders slowly.
You open Performance analyzer and identify that a visual named Orders By Date is the slowest to render.
The duration breakdown for Orders By Date is shown in the following table.

What will provide the greatest reduction in the rendering duration of Report1?
- A . Enable automatic page refresh.
- B . Optimize the DAX query of Orders By Date by using DAX Studio.
- C . Change the visual type of Orders By Date.
- D . Reduce the number of visuals in Report1.
D
Explanation:
Use Performance Analyzer to examine report element performance in Power BI Desktop
Each visual’s log information includes the time spent (duration) to complete the following categories of tasks:
DAX query – if a DAX query was required, this is the time between the visual sending the query, and for Analysis Services to return the results.
Visual display – time required for the visual to draw on the screen, including time required to retrieve any web images or geocoding.
Other – time required by the visual for preparing queries, waiting for other visuals to complete, or performing other background processing.
Reference: https://learn.microsoft.com/en-us/power-bi/create-reports/desktop-performance-analyzer
You have a Microsoft Power BI report named Report1 that uses a Fabric semantic model.
Users discover that Report1 renders slowly.
You open Performance analyzer and identify that a visual named Orders By Date is the slowest to render.
The duration breakdown for Orders By Date is shown in the following table.
What will provide the greatest reduction in the rendering duration of Report1?
- A . Enable automatic page refresh.
- B . Optimize the DAX query of Orders By Date by using DAX Studio.
- C . Change the visual type of Orders By Date.
- D . Reduce the number of visuals in Report1.
D
Explanation:
Use Performance Analyzer to examine report element performance in Power BI Desktop
Each visual’s log information includes the time spent (duration) to complete the following categories of tasks:
DAX query – if a DAX query was required, this is the time between the visual sending the query, and for Analysis Services to return the results.
Visual display – time required for the visual to draw on the screen, including time required to retrieve any web images or geocoding.
Other – time required by the visual for preparing queries, waiting for other visuals to complete, or performing other background processing.
Reference: https://learn.microsoft.com/en-us/power-bi/create-reports/desktop-performance-analyzer
You have a Fabric workspace named Workspace1 that is assigned to a newly created Fabric capacity named Capacity1.
You create a semantic model named Model1 and deploy Model1 to Workspace1. You need to publish changes to Model1 directly from Tabular Editor.
What should you do?
- A . For Workspace1, enable Git integration.
- B . For Model1, enable external sharing.
- C . For Workspace1, create a managed private endpoint.
- D . For Capacity1, set XMLA Endpoint to Read Write.
D
Explanation:
To publish changes to Model1 directly from Tabular Editor, the XMLA Endpoint must be set to Read Write in Fabric Capacity settings. This allows external tools like Tabular Editor, SSMS, and Power BI ALM Toolkit to connect, modify, and publish changes to the semantic model.
HOTSPOT
You have the following KQL query.

For each of the following statements, select Yes if the statement is true. Otherwise, select No. NOTE: Each correct selection is worth one point.


Explanation:
where Status != "Cancelled": Excludes records where the Status is "Cancelled".
where OrderDate >= ago(30d): Filters for records where the OrderDate is within the last 30 days.
summarize TotalSales = sum(SalesAmount) by ProductCategory: Calculates the total sales (SalesAmount) for each product category.
where TotalSales > 0: Filters out product categories where the total sales are zero or less. The query excludes sales that have a Status of Cancelled – Yes
The where Status != "Cancelled" condition ensures that rows with a "Cancelled" status are excluded.
The query calculates the total sales of each product category for the last 30 days – Yes The combination of where OrderDate >= ago(30d) and summarize TotalSales = sum (SalesAmount) by ProductCategory calculates the total sales for each product category for the last 30 days.
The query includes product categories that have had zero sales during the last 30 days – No The where TotalSales > 0 condition filters out product categories with zero sales.