
Practice Free DP-600 Exam Online Questions
HOTSPOT
You have two Microsoft Power BI queries named Employee and Retired Roles.
You need to merge the Employee query with the Retired Roles query. The solution must ensure that duplicate rows in each query are removed.
Which column and Join Kind should you use in Power Query Editor? To answer, select the appropriate options in the answer area. NOTE: Each correct answer is worth one point.


Explanation:
Box 1: Division
Power Query, Merge queries overview
The Division column and the Role column appear in both tables.
Box 2: Inner Join
Inner join as duplicate rows in each query must be removed.
Reference: https://learn.microsoft.com/en-us/power-query/merge-queries-overview
You have a Fabric tenant that contains customer churn data stored as Parquet files in OneLake. The data contains details about customer demographics and product usage.
You create a Fabric notebook to read the data into a Spark DataFrame. You then create column charts in the notebook that show the distribution of retained customers as compared to lost customers based on geography, the number of products purchased, age, and customer tenure.
Which type of analytics are you performing?
- A . diagnostic
- B . descriptive
- C . prescriptive
- D . predictive
B
Explanation:
What is Customer Retention Analytics?
Customer retention analytics provide predictive metrics of which customers may churn, allowing businesses to prevent this from happening. Let us understand this by an example, by using customer retention analytics, companies can reduce churn and increase profits, as evidenced by a McKinsey report suggesting that extensive use of customer data analytics can drive profit. Customer retention metrics, including the customer retention rate, are used to measure the likelihood of retaining and attracting customers to a business. This is how data analytics helps in customer retention.
Descriptive Analytics
Descriptive analytics provide you with granular insights based on historical data. This includes tracking past purchases, customer complaints, customer service reviews, and more. In order to implement descriptive customer retention analytics, your cloud engineers would need to make sure all customer data is on-premise and up-to-date and backed up on a regular basis. Because it uses historical data to create retention strategies and personalize customer experiences, all historical data must be accessible for analysis.
Incorrect:
* Predictive Analytics
This works in tandеm with dеscriptivе analytics, which allows you to forеcast the behavior of your customers based on past data. This allows you to prеparе for specific customеr intе ractions and improv е customеr rеtеntion. For еxamplе, you can usе historical transactions to prеdict how likely a customer is to rеnеw their subscription at a music plan. Thе nеxt timе that customеr walks into thе studio, your staff will rеcеivе an alеrt to offеr additional incеntivеs to pеrsuadе thеm to rеnеw.
* Prescriptive Analytics
Prescriptive analytics finds solutions based on insights from descriptive analytics. For example, you can collect data about remedial solutions to improve retention and see how well they performed. Prescriptive analytics forces you to retrospectively evaluate all strategies to improve them. For example, a bank might use Fraud Detection. An algorithm evaluates historical data after making a purchase to see if it matches the typical level of spending. If it detects an anomaly, the bank will be notified and will recommend a course of action, such as cancelling the bank card.
* Diagnostic Analytics
Diagnostic analytics involves the collection and examination of data pertaining to a particular issue or occurrence in order to comprehend the underlying causes. Consider a scenario where a fitness app, GymFit, observes a significant drop in user engagement during a specific period. Unraveling the factors contributing to this decline becomes the focal point of diagnostic analytics. In this context, GymFit delves
into the data to uncover reasons why users might be disengaging, such as changes in workout preferences, dissatisfaction with features, or scheduling conflicts. Through careful analysis, GymFit identifies patterns and root causes behind the drop in user engagement. Armed with this knowledge, the fitness app can then implement targeted improvements, addressing concerns and enhancing the overall user experience to prevent further disengagement and attract new users.
Reference: https://emergingindiagroup.com/data-analytics-for-customer-retention/
DRAG DROP
You are building a solution by using a Fabric notebook.
You have a Spark DataFrame assigned to a variable named df. The DataFrame returns four columns.
You need to change the data type of a string column named Age to integer. The solution must return a DataFrame that includes all the columns.
How should you complete the code? To answer, drag the appropriate values to the correct targets. Each value may be used once, more than once, or not at all. You may need to drag the split bar between panes or scroll to view content. NOTE: Each correct selection is worth one point.
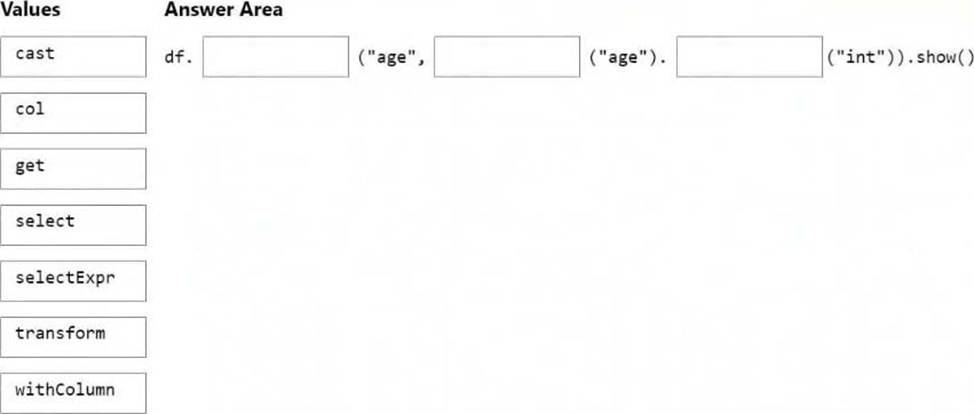

Explanation:
Box 1: withColumn
In PySpark, we can use the cast method to change the data type.
from pyspark.sql.types import IntegerType
from pyspark.sql import functions as F
# first method
df = df.withColumn("Age", df.age.cast("int"))
# second method
df = df.withColumn("Age", df.age.cast(IntegerType()))
# third method <– This one
df = df.withColumn("Age", F.col("Age").cast(IntegerType()))
Box 2: col
Box 3: cast
Reference: https://www.aporia.com/resources/how-to/change-column-data-types-in-dataframe/
HOTSPOT
You have a Fabric tenant that contains a semantic model named model1.
The two largest columns in model1 are shown in the following table.

You need to optimize model1.
The solution must meet the following requirements:
– Reduce the model size.
– Increase refresh performance when using Import mode.
– Ensure that the datetime value for each sales transaction is available in the model.
What should you do on each column? To answer, select the appropriate options in the answer area. NOTE: Each correct selection is worth one point.


Explanation:
Box 1: Remove the column.
TransactionKey
Remove the surrogate key.
Box 2: Split the column
SaleDateTime
Split the datetime column.
Reference: https://powerbi.microsoft.com/pl-pl/blog/best-practice-rules-to-improve-your-models-performance/
You have a Fabric tenant that contains a Microsoft Power BI report named Report1. Report1 includes a Python visual.
Data displayed by the visual is grouped automatically and duplicate rows are NOT displayed.
You need all rows to appear in the visual.
What should you do?
- A . Reference the columns in the Python code by index.
- B . Modify the Sort Column By property for all columns.
- C . Add a unique field to each row.
- D . Modify the Summarize By property for all columns.
You have a Fabric tenant that contains a semantic model named Model1. Model1 uses Import mode.
Model1 contains a table named Orders.
Orders has 100 million rows and the following fields.

You need to reduce the memory used by Model1 and the time it takes to refresh the model.
Which two actions should you perform? Each correct answer presents part of the solution. NOTE: Each correct answer is worth one point.
- A . Split OrderDateTime into separate date and time columns.
- B . Replace TotalQuantity with a calculated column.
- C . Convert Quantity into the Text data type.
- D . Replace TotalSalesAmount with a measure.
HOTSPOT
You have a KQL database that contains a table named Readings.
You need to query Readings and return the results shown in the following table.

How should you complete the query? To answer, select the appropriate options in the answer area. NOTE: Each correct selection is worth one point.
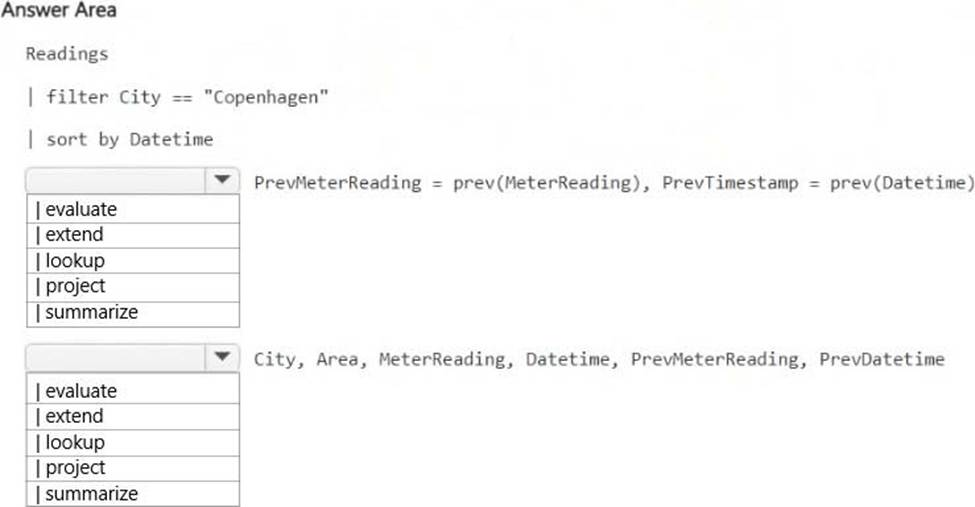

Explanation:

| extend
The prev() function retrieves the previous row’s value based on the sorted order.
extend PrevMeterReading = prev(MeterReading), PrevDatetime = prev(Datetime)
assigns these previous values.
| project
Used to select specific columns for the final result set. Ensures that City, Area, MeterReading, Datetime, PrevMeterReading, and PrevDatetime are included in the output.
HOTSPOT
You have a Fabric warehouse that contains two tables named DimDate and Trips.
DimDate contains the following fields.

Trips contains the following fields.

You need to compare the average miles per trip for statutory holidays versus non-statutory holidays.
How should you complete the T-SQL statement? To answer, select the appropriate options in the answer area. NOTE: Each correct selection is worth one point.


Explanation:
Box 1: (Sum(t.tripDistance)/count(t.tripID))
average miles per trip
total miles: Sum(t.tripDistance)
number of trips: count(t.tripID)
Box 2: group by
Group by on the Holiday column to get results for both statutory holidays and non-statutory holidays.
HOTSPOT
You have a Fabric warehouse that contains two tables named DimDate and Trips.
DimDate contains the following fields.
Trips contains the following fields.
You need to compare the average miles per trip for statutory holidays versus non-statutory holidays.
How should you complete the T-SQL statement? To answer, select the appropriate options in the answer area. NOTE: Each correct selection is worth one point.
Explanation:
Box 1: (Sum(t.tripDistance)/count(t.tripID))
average miles per trip
total miles: Sum(t.tripDistance)
number of trips: count(t.tripID)
Box 2: group by
Group by on the Holiday column to get results for both statutory holidays and non-statutory holidays.