
Practice Free Databricks Certified Professional Data Engineer Exam Online Questions
A table is registered with the following code:
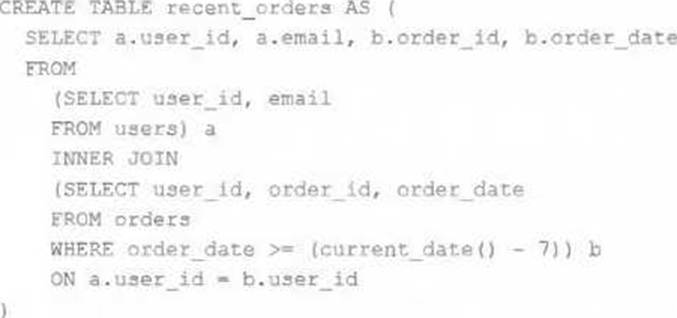
Both users and orders are Delta Lake tables.
Which statement describes the results of querying recent_orders?
- A . All logic will execute at query time and return the result of joining the valid versions of the source tables at the time the query finishes.
- B . All logic will execute when the table is defined and store the result of joining tables to the DBFS; this stored data will be returned when the table is queried.
- C . Results will be computed and cached when the table is defined; these cached results will incrementally update as new records are inserted into source tables.
- D . All logic will execute at query time and return the result of joining the valid versions of the source
tables at the time the query began. - E . The versions of each source table will be stored in the table transaction log; query results will be saved to DBFS with each query.
What is true for Delta Lake?
- A . Views in the Lakehouse maintain a valid cache of the most recent versions of source tables at all times.
- B . Delta Lake automatically collects statistics on the first 32 columns of each table, which are leveraged in data skipping based on query filters.
- C . Z-ORDER can only be applied to numeric values stored in Delta Lake tables.
- D . Primary and foreign key constraints can be leveraged to ensure duplicate values are never entered into a dimension table.
B
Explanation:
Delta Lake automatically collects statistics on the first 32 columns of each table. These statistics help optimize query performance through data skipping, which allows Databricks to scan only relevant parts of a table.
This feature significantly improves query efficiency, especially when dealing with large datasets.
Why Other Options Are Incorrect:
Option A: Views do not cache the most recent versions of the source table; they are recomputed when queried.
Option C: Z-ORDER can be applied to any data type, including strings, to optimize read performance.
Option D: Delta Lake does not enforce primary or foreign key constraints.
Reference: Delta Lake Optimization
A data engineer wants to automate job monitoring and recovery in Databricks using the Jobs API.
They need to list all jobs, identify a failed job, and rerun it.
Which sequence of API actions should the data engineer perform?
- A . Use the jobs/list endpoint to list jobs, check job run statuses with jobs/runs/list, and rerun a failed job using jobs/run-now.
- B . Use the jobs/get endpoint to retrieve job details, then use jobs/update to rerun failed jobs.
- C . Use the jobs/list endpoint to list jobs, then use the jobs/create endpoint to create a new job, and run the new job using jobs/run-now.
- D . Use the jobs/cancel endpoint to remove failed jobs, then recreate them with jobs/create and run the new ones.
A
Explanation:
Comprehensive and Detailed Explanation From Exact Extract of Databricks Data Engineer Documents:
The Databricks Jobs REST API provides several endpoints for automation.
The correct monitoring and rerun flow uses three specific calls:
GET /api/2.1/jobs/list C Lists all available jobs within the workspace.
GET /api/2.1/jobs/runs/list C Returns all runs for a specific job, including their current state (e.g., TERMINATED: FAILED).
POST /api/2.1/jobs/run-now C Immediately triggers a rerun of the specified job.
This sequence aligns with Databricks’ prescribed automation model for job observability and recovery. Using jobs/update modifies metadata but does not rerun jobs, and jobs/create is only used for creating new jobs, not rerunning failed ones. Cancelling and recreating jobs introduces unnecessary duplication. Therefore, option A is the correct automated recovery workflow.
A Spark job is taking longer than expected. Using the Spark UI, a data engineer notes that the Min, Median, and Max Durations for tasks in a particular stage show the minimum and median time to complete a task as roughly the same, but the max duration for a task to be roughly 100 times as long as the minimum.
Which situation is causing increased duration of the overall job?
- A . Task queueing resulting from improper thread pool assignment.
- B . Spill resulting from attached volume storage being too small.
- C . Network latency due to some cluster nodes being in different regions from the source data
- D . Skew caused by more data being assigned to a subset of spark-partitions.
- E . Credential validation errors while pulling data from an external system.
D
Explanation:
This is the correct answer because skew is a common situation that causes increased duration of the overall job. Skew occurs when some partitions have more data than others, resulting in uneven distribution of work among tasks and executors. Skew can be caused by various factors, such as skewed data distribution, improper partitioning strategy, or join operations with skewed keys. Skew can lead to performance issues such as long-running tasks, wasted resources, or even task failures due to memory or disk spills.
Verified Reference: [Databricks Certified Data Engineer Professional], under “Performance Tuning” section; Databricks Documentation, under “Skew” section.
A production workload incrementally applies updates from an external Change Data Capture feed to a Delta Lake table as an always-on Structured Stream job. When data was initially migrated for this table, OPTIMIZE was executed and most data files were resized to 1 GB. Auto Optimize and Auto Compaction were both turned on for the streaming production job. Recent review of data files shows that most data files are under 64 MB, although each partition in the table contains at least 1 GB of data and the total table size is over 10 TB.
Which of the following likely explains these smaller file sizes?
- A . Databricks has autotuned to a smaller target file size to reduce duration of MERGE operations
- B . Z-order indices calculated on the table are preventing file compaction
C Bloom filler indices calculated on the table are preventing file compaction - C . Databricks has autotuned to a smaller target file size based on the overall size of data in the table
- D . Databricks has autotuned to a smaller target file size based on the amount of data in each partition
A
Explanation:
This is the correct answer because Databricks has a feature called Auto Optimize, which automatically optimizes the layout of Delta Lake tables by coalescing small files into larger ones and sorting data within each file by a specified column. However, Auto Optimize also considers the trade-off between file size and merge performance, and may choose a smaller target file size to reduce the duration of merge operations, especially for streaming workloads that frequently update existing records. Therefore, it is possible that Auto Optimize has autotuned to a smaller target file size based on the characteristics of the streaming production job.
Verified Reference: [Databricks Certified Data Engineer Professional], under “Delta Lake” section; Databricks Documentation, under “Auto
Optimize” section. https://docs.databricks.com/en/delta/tune-file-size.html#autotune-table ‘Autotune file size based on workload’
A Delta Lake table representing metadata about content posts from users has the following schema:
user_id LONG
post_text STRING
post_id STRING
longitude FLOAT
latitude FLOAT
post_time TIMESTAMP
date DATE
Based on the above schema, which column is a good candidate for partitioning the Delta Table?
- A . date
- B . user_id
- C . post_id
- D . post_time
A
Explanation:
Partitioning a Delta Lake table is a strategy used to improve query performance by dividing the table into distinct segments based on the values of a specific column. This approach allows queries to scan only the relevant partitions, thereby reducing the amount of data read and enhancing performance.
Considerations for Choosing a Partition Column:
Cardinality: Columns with high cardinality (i.e., a large number of unique values) are generally poor choices for partitioning. High cardinality can lead to a large number of small partitions, which can degrade performance.
Query Patterns: The partition column should align with common query filters. If queries frequently filter data based on a particular column, partitioning by that column can be beneficial.
Partition Size: Each partition should ideally contain at least 1 GB of data. This ensures that partitions are neither too small (leading to too many partitions) nor too large (negating the benefits of partitioning).
Evaluation of Columns:
date:
Cardinality: Typically low, especially if data spans over days, months, or years.
Query Patterns: Many analytical queries filter data based on date ranges.
Partition Size: Likely to meet the 1 GB threshold per partition, depending on data volume.
user_id:
Cardinality: High, as each user has a unique ID.
Query Patterns: While some queries might filter by user_id, the high cardinality makes it unsuitable for partitioning.
Partition Size: Partitions could be too small, leading to inefficiencies.
post_id:
Cardinality: Extremely high, with each post having a unique ID.
Query Patterns: Unlikely to be used for filtering large datasets.
Partition Size: Each partition would be very small, resulting in a large number of partitions.
post_time:
Cardinality: High, especially if it includes exact timestamps.
Query Patterns: Queries might filter by time, but the high cardinality poses challenges.
Partition Size: Similar to user_id, partitions could be too small.
Conclusion:
Given the considerations, the date column is the most suitable candidate for partitioning. It has low cardinality, aligns with common query patterns, and is likely to result in appropriately sized partitions.
Reference: Delta Lake Best Practices
Partitioning in Delta Lake
In order to facilitate near real-time workloads, a data engineer is creating a helper function to leverage the schema detection and evolution functionality of Databricks Auto Loader. The desired function will automatically detect the schema of the source directly, incrementally process JSON files as they arrive in a source directory, and automatically evolve the schema of the table when new fields are detected.
The function is displayed below with a blank:
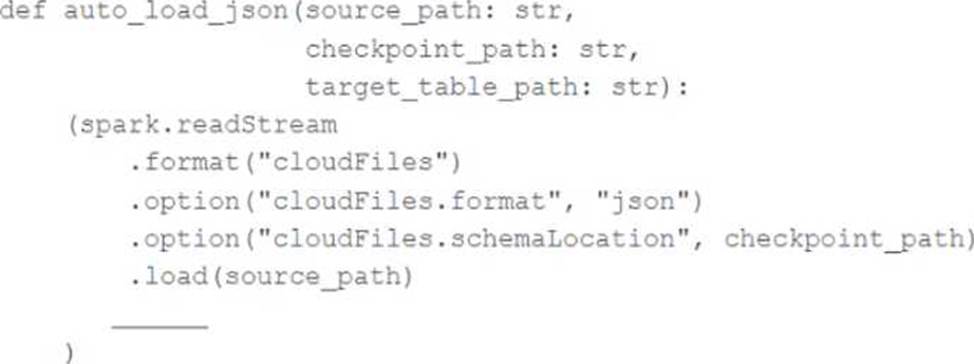
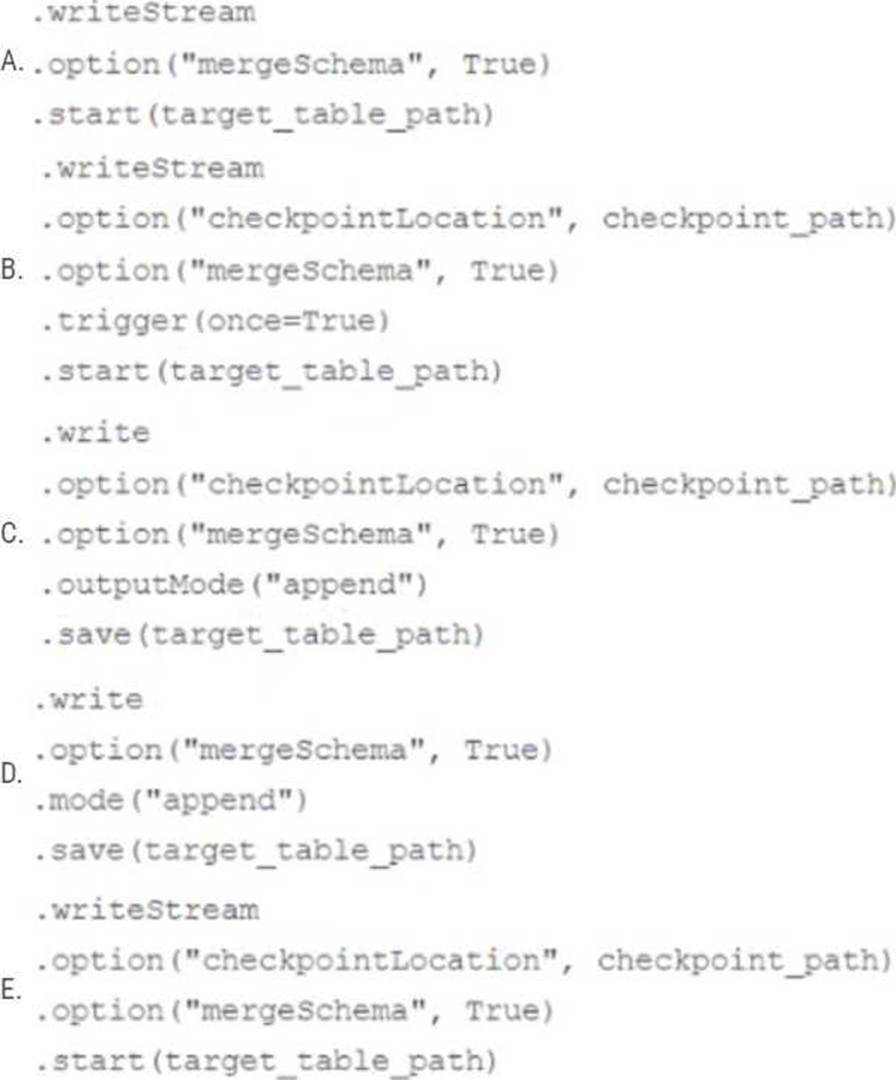
Which response correctly fills in the blank to meet the specified requirements?
- A . Option A
- B . Option B
- C . Option C
- D . Option D
- E . Option E
B
Explanation:
Option B correctly fills in the blank to meet the specified requirements.
Option B uses the “cloudFiles.schemaLocation” option, which is required for the schema detection and evolution functionality of Databricks Auto Loader. Additionally, option B uses the “mergeSchema” option, which is required for the schema evolution functionality of Databricks Auto Loader. Finally, option B uses the “writeStream” method, which is required for the incremental processing of JSON files as they arrive in a source directory. The other options are incorrect because they either omit the required options, use the wrong method, or use the wrong format.
Reference:
Configure schema inference and evolution in Auto Loader: https://docs.databricks.com/en/ingestion/auto-loader/schema.html
Write streaming data: https://docs.databricks.com/spark/latest/structured-streaming/writing-streaming-data.html
The data engineering team is migrating an enterprise system with thousands of tables and views into the Lakehouse. They plan to implement the target architecture using a series of bronze, silver, and gold tables. Bronze tables will almost exclusively be used by production data engineering workloads, while silver tables will be used to support both data engineering and machine learning workloads. Gold tables will largely serve business intelligence and reporting purposes. While personal identifying information (PII) exists in all tiers of data, pseudonymization and anonymization rules are in place for all data at the silver and gold levels.
The organization is interested in reducing security concerns while maximizing the ability to collaborate across diverse teams.
Which statement exemplifies best practices for implementing this system?
- A . Isolating tables in separate databases based on data quality tiers allows for easy permissions management through database ACLs and allows physical separation of default storage locations for managed tables.
- B . Because databases on Databricks are merely a logical construct, choices around database organization do not impact security or discoverability in the Lakehouse.
- C . Storinq all production tables in a single database provides a unified view of all data assets available throughout the Lakehouse, simplifying discoverability by granting all users view privileges on this database.
- D . Working in the default Databricks database provides the greatest security when working with managed tables, as these will be created in the DBFS root.
- E . Because all tables must live in the same storage containers used for the database they’re created in, organizations should be prepared to create between dozens and thousands of databases
depending on their data isolation requirements.
A
Explanation:
This is the correct answer because it exemplifies best practices for implementing this system. By isolating tables in separate databases based on data quality tiers, such as bronze, silver, and gold, the data engineering team can achieve several benefits. First, they can easily manage permissions for different users and groups through database ACLs, which allow granting or revoking access to databases, tables, or views. Second, they can physically separate the default storage locations for managed tables in each database, which can improve performance and reduce costs. Third, they can provide a clear and consistent naming convention for the tables in each database, which can improve discoverability and usability.
Verified Reference: [Databricks Certified Data Engineer Professional], under “Lakehouse” section; Databricks Documentation, under “Database object privileges” section.
A data pipeline uses Structured Streaming to ingest data from kafka to Delta Lake. Data is being stored in a bronze table, and includes the Kafka_generated timesamp, key, and value. Three months after the pipeline is deployed the data engineering team has noticed some latency issued during certain times of the day.
A senior data engineer updates the Delta Table’s schema and ingestion logic to include the current timestamp (as recoded by Apache Spark) as well the Kafka topic and partition. The team plans to use the additional metadata fields to diagnose the transient processing delays:
Which limitation will the team face while diagnosing this problem?
- A . New fields not be computed for historic records.
- B . Updating the table schema will invalidate the Delta transaction log metadata.
- C . Updating the table schema requires a default value provided for each file added.
- D . Spark cannot capture the topic partition fields from the kafka source.
A
Explanation:
When adding new fields to a Delta table’s schema, these fields will not be retrospectively applied to historical records that were ingested before the schema change. Consequently, while the team can use the new metadata fields to investigate transient processing delays moving forward, they will be unable to apply this diagnostic approach to past data that lacks these fields.
Reference: Databricks documentation on Delta Lake schema management:
https://docs.databricks.com/delta/delta-batch.html#schema-management
A platform team lead is responsible for automating SQL Warehouse usage attribution across business units. They need to identify warehouse usage at the individual user level and share a daily usage report with an executive team that includes business leaders from multiple departments.
How should the platform lead generate an automated report that can be shared daily?
- A . Use system tables to capture audit and billing usage data and share the queries with the executive team for manual execution.
- B . Use system tables to capture audit and billing usage data and create a dashboard with a daily refresh schedule shared with the executive team.
- C . Restrict users from running SQL queries unless they provide query details for attribution tracking.
- D . Let users run queries normally and have individual teams manually report usage to the executive
team.
B
Explanation:
Comprehensive and Detailed Explanation From Exact Extract of Databricks Data Engineer Documents:
Databricks provides system tables under the system.billing and system.access schemas for auditing and cost attribution across SQL Warehouses. The best practice is to build a dashboard in Databricks SQL using these system tables and configure it with a daily refresh schedule. This ensures automated, up-to-date reporting of compute consumption, user activity, and cost distribution. Sharing this dashboard with executives provides transparency without requiring them to run queries manually. This approach aligns with Databricks’ operational guidance on workspace observability and cost governance, making B the correct answer.