
Practice Free Databricks Certified Professional Data Engineer Exam Online Questions
A facilities-monitoring team is building a near-real-time PowerBI dashboard off the Delta table device_readings:
Columns:
device_id (STRING, unique sensor ID)
event_ts (TIMESTAMP, ingestion timestamp UTC)
temperature_c (DOUBLE, temperature in °C)
Requirement:
For each sensor, generate one row per non-overlapping 5-minute interval, offset by 2 minutes (e.g., 00:02C00:07, 00:07C00:12, …).
Each row must include interval start, interval end, and average temperature in that slice. Downstream BI tools (e.g., Power BI) must use the interval timestamps to plot time-series bars. Options:
- A . WITH buckets AS (SELECT device_id,window(event_ts, ‘5 minutes’, ‘2 minutes’, ‘5 minutes’) AS win,temperature_cFROM device_readings)SELECT device_id,win.start AS bucket_start,win.end AS bucket_end,AVG(temperature_c) AS avg_temp_5mFROM bucketsGROUP BY device_id, winORDER BY device_id, bucket_start;
- B . SELECT device_id,event_ts,AVG(temperature_c) OVER (PARTITION BY device_idORDER BY
event_tsRANGE BETWEEN INTERVAL 5 MINUTES PRECEDING AND CURRENT ROW) AS
avg_temp_5mFROM device_readingsWINDOW w AS (window(event_ts, ‘5 minutes’, ‘2 minutes’)); - C . SELECT device_id,date_trunc(‘minute’, event_ts – INTERVAL 2 MINUTES) + INTERVAL 2 MINUTES
AS bucket_start,date_trunc(‘minute’, event_ts – INTERVAL 2 MINUTES) + INTERVAL 7 MINUTES AS bucket_end,AVG(temperature_c) AS avg_temp_5mFROM device_readingsGROUP BY device_id, date_trunc(‘minute’, event_ts – INTERVAL 2 MINUTES)ORDER BY device_id, bucket_start; - D . SELECT device_id,window.start AS bucket_start,window.end AS bucket_end,AVG(temperature_c) AS avg_temp_5mFROM device_readingsGROUP BY device_id, window(event_ts, ‘5 minutes’, ‘5 minutes’, ‘2 minutes’)ORDER BY device_id, bucket_start;
A
Explanation:
The correct way to satisfy non-overlapping windows with an offset in Databricks SQL is to use the window function with three parameters: window duration, slide duration, and start offset.
In option A, the function call:
window(event_ts, ‘5 minutes’, ‘2 minutes’, ‘5 minutes’)
creates 5-minute windows that slide every 5 minutes, with a 2-minute offset, which exactly matches the requirement (intervals like 00:02C00:07, 00:07C00:12, …).
Option B is incorrect because it uses a windowed aggregation with RANGE, which produces overlapping sliding averages, not discrete non-overlapping buckets.
Option C manually constructs bucket boundaries with date_trunc and offsets, but this is brittle and less efficient than the built-in window function.
Option D incorrectly passes four parameters to window but with the wrong ordering (5 minutes, 5 minutes, 2 minutes). This creates a sliding window every 5 minutes with overlap, rather than true non-overlapping shifted windows.
Reference (Databricks SQL Windowing Functions):
Databricks documentation specifies that:
window(time_col, windowDuration, slideDuration, startTime)
produces tumbling or sliding windows. When slideDuration = windowDuration, it produces non-overlapping tumbling windows. The startTime argument allows for offset windows, which is why ‘2 minutes’ ensures alignment at 00:02, 00:07, etc.
Thus, A is the only correct solution as it directly implements non-overlapping, offset-based tumbling
windows.
A data engineer is running a groupBy aggregation on a massive user activity log grouped by user_id.
A few users have millions of records, causing task skew and long runtimes.
Which technique will fix the skew in this aggregation?
- A . Use salting by adding a random prefix to skewed keys before aggregation, then aggregate again after removing the prefix.
- B . Increase the Spark driver memory and retry.
- C . Use reduceByKey instead of groupBy to avoid shuffles.
- D . Filter out the skewed users before the aggregation.
A
Explanation:
Task skew occurs when a small subset of keys holds a disproportionate amount of data, causing certain tasks to process significantly more records than others. Databricks documentation recommends salting as an effective mitigation technique.
Salting introduces a random or calculated prefix to skewed keys, distributing records across multiple partitions and balancing the workload during the shuffle stage. After aggregation, a second pass re-aggregates results by removing the prefix to restore key integrity.
Increasing memory (B) does not resolve distribution imbalance; reduceByKey (C) still triggers
shuffles; and filtering (D) would remove valid business data. Hence, salting is the correct and officially recommended approach to address skew in Spark aggregations.
Which REST API call can be used to review the notebooks configured to run as tasks in a multi-task job?
- A . /jobs/runs/list
- B . /jobs/runs/get-output
- C . /jobs/runs/get
- D . /jobs/get
- E . /jobs/list
D
Explanation:
This is the correct answer because it is the REST API call that can be used to review the notebooks configured to run as tasks in a multi-task job. The REST API is an interface that allows programmatically interacting with Databricks resources, such as clusters, jobs, notebooks, or tables. The REST API uses HTTP methods, such as GET, POST, PUT, or DELETE, to perform operations on these resources. The /jobs/get endpoint is a GET method that returns information about a job given its job ID. The information includes the job settings, such as the name, schedule, timeout, retries, email notifications, and tasks. The tasks are the units of work that a job executes. A task can be a notebook task, which runs a notebook with specified parameters; a jar task, which runs a JAR uploaded to DBFS with specified main class and arguments; or a python task, which runs a Python file uploaded to DBFS with specified parameters. A multi-task job is a job that has more than one task configured to run in a specific order or in parallel. By using the /jobs/get endpoint, one can review the notebooks configured to run as tasks in a multi-task job.
Verified Reference: [Databricks Certified Data Engineer Professional], under “Databricks Jobs” section; Databricks Documentation, under “Get” section;
Databricks Documentation, under “JobSettings” section.
The following table consists of items found in user carts within an e-commerce website.

The following MERGE statement is used to update this table using an updates view, with schema evaluation enabled on this table.
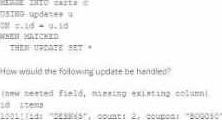
How would the following update be handled?
- A . The update is moved to separate ”restored” column because it is missing a column expected in the target schema.
- B . The new restored field is added to the target schema, and dynamically read as NULL for existing unmatched records.
- C . The update throws an error because changes to existing columns in the target schema are not supported.
- D . The new nested field is added to the target schema, and files underlying existing records are updated to include NULL values for the new field.
D
Explanation:
With schema evolution enabled in Databricks Delta tables, when a new field is added to a record through a MERGE operation, Databricks automatically modifies the table schema to include the new field. In existing records where this new field is not present, Databricks will insert NULL values for that field. This ensures that the schema remains consistent across all records in the table, with the new field being present in every record, even if it is NULL for records that did not originally include it.
:
Databricks documentation on schema evolution in Delta Lake:
https://docs.databricks.com/delta/delta-batch.html#schema-evolution
A data engineer deploys a multi-task Databricks job that orchestrates three notebooks. One task intermittently fails with Exit Code 1 but succeeds on retry. The engineer needs to collect detailed logs for the failing attempts, including stdout/stderr and cluster lifecycle context, and share them with the platform team.
What steps the data engineer needs to follow using built-in tools?
- A . Use the notebook interactive debugger to re-run the entire multi-task job, and capture step-through traces for the failing task.
- B . Download worker logs directly from the Spark UI and ignore driver logs, as worker logs contain stdout/stderr for all tasks and cluster events.
- C . Export the notebook run results to HTML; this bundle includes complete stdout, stderr, and cluster event history across all tasks.
- D . From the job run details page, export the job’s logs or configure log delivery; then retrieve the compute driver logs and event logs from the compute details page to correlate stdout/stderr with cluster events.
D
Explanation:
The recommended way to troubleshoot and collect detailed job logs is through the Job Run Details page in Databricks. From there, engineers can export run logs or configure automatic log delivery to a storage destination. The driver and event logs available under compute details provide stdout, stderr, and cluster lifecycle context required for root-cause analysis.
Reference Source: Databricks Jobs Monitoring and Logging Documentation C “Access driver logs and configure log delivery.”
A data engineer has configured their Databricks Asset Bundle with multiple targets in databricks.yml and deployed it to the production workspace. Now, to validate the deployment, they need to invoke a job named my_project_job specifically within the prod target context. Assuming the job is already deployed, they need to trigger its execution while ensuring the target-specific configuration is respected.
Which command will trigger the job execution?
- A . databricks execute my_project_job -e prod
- B . databricks job run my_project_job –env prod
- C . databricks run my_project_job -t prod
- D . databricks bundle run my_project_job -t prod
D
Explanation:
Databricks Asset Bundles (DABs) enable declarative configuration and deployment of Databricks resources such as jobs, pipelines, and dashboards across multiple environments.
Once deployed, jobs can be executed in a specific target context using the databricks bundle run command, which ensures all environment-specific configurations from the bundle definition (such as parameters, cluster settings, and workspace URLs) are respected.
The -t flag specifies the target environment (e.g., dev, staging, or prod). This ensures that the execution runs with the correct configuration defined under that target in databricks.yml.
Other options (A, B, and C) are invalid because they reference deprecated or incorrect command syntax that doesn’t integrate with bundle targets. Therefore, D is the correct and verified answer.
The data architect has decided that once data has been ingested from external sources into the
Databricks Lakehouse, table access controls will be leveraged to manage permissions for all production tables and views.
The following logic was executed to grant privileges for interactive queries on a production database to the core engineering group.
GRANT USAGE ON DATABASE prod TO eng;
GRANT SELECT ON DATABASE prod TO eng;
Assuming these are the only privileges that have been granted to the eng group and that these users are not workspace administrators, which statement describes their privileges?
- A . Group members have full permissions on the prod database and can also assign permissions to other users or groups.
- B . Group members are able to list all tables in the prod database but are not able to see the results of any queries on those tables.
- C . Group members are able to query and modify all tables and views in the prod database, but cannot create new tables or views.
- D . Group members are able to query all tables and views in the prod database, but cannot create or edit anything in the database.
- E . Group members are able to create, query, and modify all tables and views in the prod database, but cannot define custom functions.
D
Explanation:
The GRANT USAGE ON DATABASE prod TO eng command grants the eng group the permission to use the prod database, which means they can list and access the tables and views in the database. The GRANT SELECT ON DATABASE prod TO eng command grants the eng group the permission to select data from the tables and views in the prod database, which means they can query the data using SQL or DataFrame API. However, these commands do not grant the eng group any other permissions, such as creating, modifying, or deleting tables and views, or defining custom functions. Therefore, the eng group members are able to query all tables and views in the prod database, but cannot create or edit anything in the database.
Reference:
Grant privileges on a database: https://docs.databricks.com/en/security/auth-authz/table-acls/grant-privileges-database.html
Privileges you can grant on Hive metastore objects: https://docs.databricks.com/en/security/auth-authz/table-acls/privileges.html
The business intelligence team has a dashboard configured to track various summary metrics for retail stories. This includes total sales for the previous day alongside totals and averages for a variety of time periods.
The fields required to populate this dashboard have the following schema:

For Demand forecasting, the Lakehouse contains a validated table of all itemized sales updated incrementally in near real-time.
This table named products_per_order, includes the following fields:

Because reporting on long-term sales trends is less volatile, analysts using the new dashboard only require data to be refreshed once daily. Because the dashboard will be queried interactively by many users throughout a normal business day, it should return results quickly and reduce total compute associated with each materialization.
Which solution meets the expectations of the end users while controlling and limiting possible costs?
- A . Use the Delta Cache to persists the products_per_order table in memory to quickly the dashboard with each query.
- B . Populate the dashboard by configuring a nightly batch job to save the required to quickly update the dashboard with each query.
- C . Use Structure Streaming to configure a live dashboard against the products_per_order table within a Databricks notebook.
- D . Define a view against the products_per_order table and define the dashboard against this view.
The Databricks CLI is use to trigger a run of an existing job by passing the job_id parameter. The response that the job run request has been submitted successfully includes a filed run_id.
Which statement describes what the number alongside this field represents?
- A . The job_id is returned in this field.
- B . The job_id and number of times the job has been are concatenated and returned.
- C . The number of times the job definition has been run in the workspace.
- D . The globally unique ID of the newly triggered run.
D
Explanation:
When triggering a job run using the Databricks CLI, the run_id field in the response represents a globally unique identifier for that particular run of the job. This run_id is distinct from the job_id. While the job_id identifies the job definition and is constant across all runs of that job, the run_id is unique to each execution and is used to track and query the status of that specific job run within the Databricks environment. This distinction allows users to manage and reference individual executions of a job directly.
A data engineering team needs to implement a tagging system for their tables as part of an automated ETL process, and needs to apply tags programmatically to tables in Unity Catalog.
Which SQL command adds tags to a table programmatically?
- A . ALTER TABLE table_name SET TAGS (‘key1’ = ‘value1’, ‘key2’ = ‘value2’);
- B . APPLY TAGS ON table_name VALUES (‘key1’ = ‘value1’, ‘key2’ = ‘value2’);
- C . COMMENT ON TABLE table_name TAGS (‘key1’ = ‘value1’, ‘key2’ = ‘value2’);
- D . SET TAGS FOR table_name AS (‘key1’ = ‘value1’, ‘key2’ = ‘value2’);
A
Explanation:
Unity Catalog in Databricks provides the ability to attach tags (key-value metadata pairs) to securable objects such as catalogs, schemas, tables, volumes, and functions. Tags are critical for governance, compliance, and automation, as they allow organizations to track metadata like sensitivity, ownership, business purpose, and retention policies directly at the object level.
According to the official Databricks SQL reference for Unity Catalog, the correct way to programmatically add tags to a table is by using the ALTER TABLE … SET TAGS command.
The syntax is:
ALTER TABLE table_name SET TAGS (‘tag_name’ = ‘tag_value’, …);
This command can be used within ETL workflows or jobs to automatically apply metadata during or after ingestion, ensuring that governance and compliance rules are embedded in the pipeline itself.
Option A is correct because it uses the supported syntax for applying tags.
Option B (APPLY TAGS) is not valid SQL in Unity Catalog and is not recognized by Databricks.
Option C confuses COMMENT with TAGS. While COMMENT can add descriptive text to a table, it does not handle tags.
Option D (SET TAGS FOR) is not a valid SQL construct in Databricks for applying tags.
Thus, Option A is the only valid and documented way to programmatically set tags on a table in Unity Catalog.
Reference: Databricks SQL Language Reference ― ALTER TABLE … SET TAGS (Unity Catalog)