
Practice Free TDA-C01 Exam Online Questions
You have the following dataset.
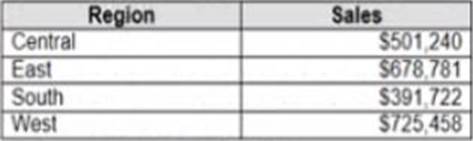
Which Level of Detail (LOD) expression should you use to calculate tie grand total of all the regions?
- A . {FIXED: [Region] SUM Sales}
- B . {FIXED: SUM Sales}
- C . {Fixed: [Region]: TOTAL Sales}
- D . {FIXED: TOTAL (Sales)}
D
Explanation:
To calculate the grand total of all the regions, you need to use a Level of Detail (LOD) expression that ignores any dimensions in the view and returns the total sum of sales. The FIXED keyword allows you to specify the level of detail for the calculation, and the TOTAL function returns the sum of all values in the expression. Therefore, the correct LOD expression is {FIXED: TOTAL (Sales)}.
Reference:
https://help.tableau.com/current/pro/desktop/en-us/calculations_calculatedfields_lod.htm https://help.tableau.com/current/pro/desktop/en-us/functions_functions_tablecalculation.htm#TOTAL
You have a data source that contains data tor every city in the Unites States.
The following is a sample of the data.
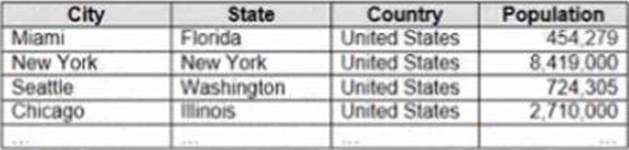
You need to use the City dimension to create a dynamic filter that snows the cities that have a population greater than one million.
Which type of filter should you use?
- A . General filter
- B . Wildcard filter
- C . Top filter
- D . Condition filter
D
Explanation:
To use the City dimension to create a dynamic filter that shows the cities that have a population greater than one million, you should use a condition filter. A condition filter is a type of filter that shows only the values that meet a specified condition based on a measure or a calculation. You can create a condition filter by dragging a dimension to the Filters shelf and selecting Condition from the dialog box. Then you can enter a formula or choose an option that defines your condition.
In this case, you want to create a condition filter based on Population, which is a measure. You can drag City to the Filters shelf and select Condition from the dialog box. Then you can choose By field from the tab and select Population > Sum > Greater than > 1000000 from the drop-down lists. This will create a condition filter that shows only the cities that have a sum of population greater than one million.
The other options are not correct for this scenario. A general filter is not a specific type of filter, but a term that refers to any type of filter in Tableau. A wildcard filter is a type of filter that shows only the values that match a specified pattern or string, such as “New*” or “*ton”. A top filter is a type of filter that shows only the top or bottom N values of a measure or dimension based on a ranking or an aggregation.
Reference:
https://help.tableau.com/current/pro/desktop/en-us/filtering.htm
https://help.tableau.com/current/pro/desktop/en-us/filtering_condition.htm
https://help.tableau.com/current/pro/desktop/en-us/filtering_wildcard.htm
https://help.tableau.com/current/pro/desktop/en-us/filtering_topn.htm
Open the link to Book1 found on the desktop. Open Disciplines worksheet.
Filter the table to show the members of the Top10 set and the members of the Bottom10 set. There should be a total of 20 rows.
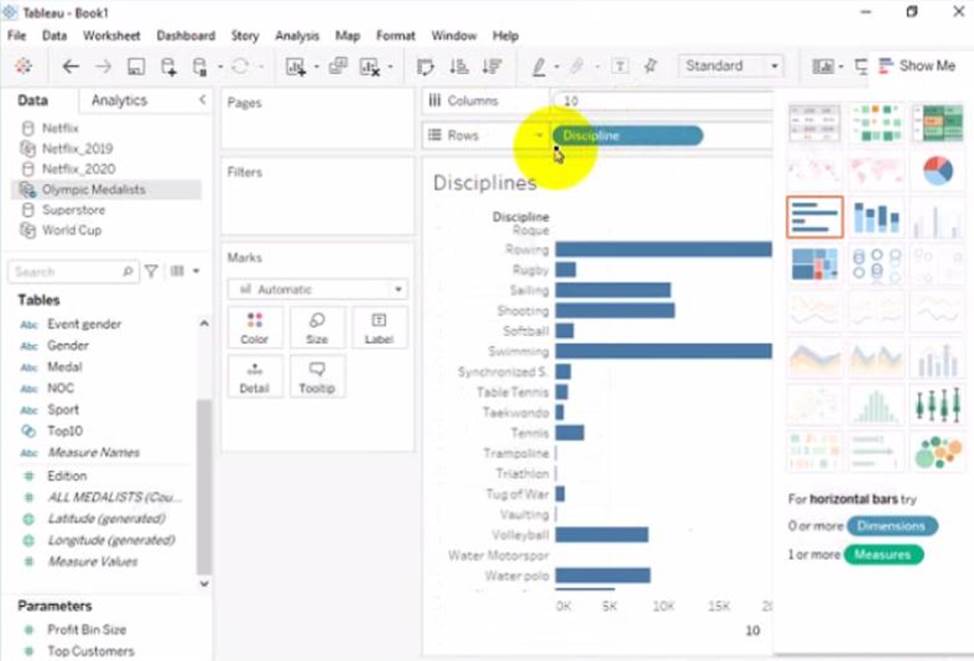
Open the link to Book1 found on the desktop. This will open the Tableau workbook that contains the Disciplines worksheet.
Click on the Disciplines tab at the bottom of the workbook to open the worksheet. You will see a table that shows the disciplines, sales, and profit for each salesperson.
Click on the drop-down arrow next to Salesperson on the Filters shelf. This will open a menu that allows you to filter by different criteria.
Select Set from the menu. This will show you the sets that are available for the Salesperson field. You will see Top10 and Bottom10 as two sets that have been created based on the sales ranking.
Check the boxes next to Top10 and Bottom10. This will filter the table to show only the members of these two sets. You can also click on All to deselect all other values.
Click OK to apply the filter. You will see that the table now shows 20 rows, 10 for each set.
Reference:
https://help.tableau.com/current/pro/desktop/en-us/sets.htm https://help.tableau.com/current/pro/desktop/en-us/filtering.htm
DRAG DROP
You conned to a Microsoft SQL Server database
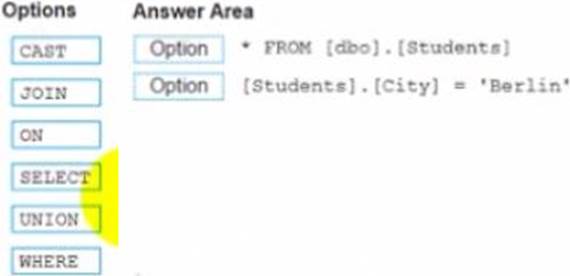
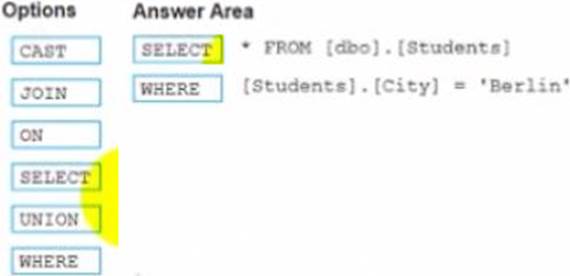
You need to create a custom SQL query that retrieves rows from a table named Students Only students m the city of Berlin must be returned
How should you complete the query? (Drag the appropriate Options to the Answer Area and drop into the correct locations.)
Explanation:
Select
Where
The correct way to complete the query is:
SELECT * FROM [dbo] . [Students]
WHERE [Students].[City] = ‘Berlin’
The SELECT statement is used to retrieve data from a table or a view. The * symbol means that all columns will be returned. The FROM clause specifies the table or view name and the schema name. The WHERE clause is used to filter the data based on a condition. The condition is [Students].[City] = ‘Berlin’, which means that only rows where the City column of the Students table is equal to ‘Berlin’ will be returned.
The other options are not relevant for this query. CAST is a function that converts a value from one data type to another. JOIN is a clause that combines data from two or more tables based on a common field. ON is a keyword that specifies the join condition. UNION is a set operation that combines the results of two or more queries into one result set.
Reference:
https://docs.microsoft.com/en-us/sql/t-sql/queries/select-transact-sql?view=sql-server-ver15
https://docs.microsoft.com/en-us/sql/t-sql/queries/where-transact-sql?view=sql-server-ver15
https://docs.microsoft.com/en-us/sql/t-sql/functions/cast-and-convert-transact-sql?view=sql-server-ver15
https://docs.microsoft.com/en-us/sql/t-sql/queries/from-transact-sql?view=sql-server-ver15#join
https://docs.microsoft.com/en-us/sql/t-sql/language-elements/set-operators-union-transact-sql?view=sql-server-ver15
You have the following dashboard that contains two visualizations.
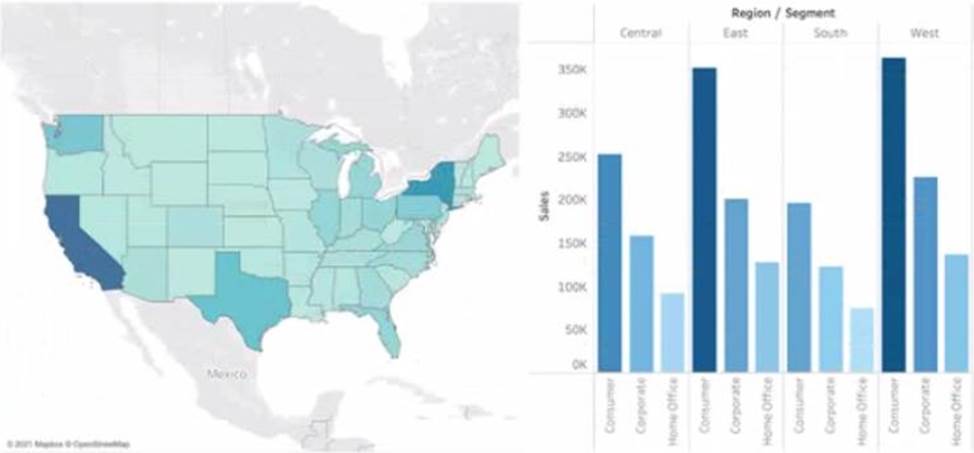
You want to show only visualization at time. Users must be able to switch between visualizations.
What should you me?
- A . A parameter and a calculated filed
- B . Worksheet actions
- C . Showhide buttons
- D . Dashboard actions
C
Explanation:
Showhide buttons are a feature that allows you to show or hide a layout container on a dashboard. You can use showhide buttons to create a toggle effect that switches between two visualizations. You need to place each visualization in a separate layout container and then add a showhide button for each container. You can customize the appearance and behavior of the buttons to suit your needs.
Reference:
https://help.tableau.com/current/pro/desktop/en-us/dashboards_organize_floating_layoutcontainers.htm
https://help.tableau.com/current/pro/desktop/en-us/dashboards_showhide.htm
You have the following table.
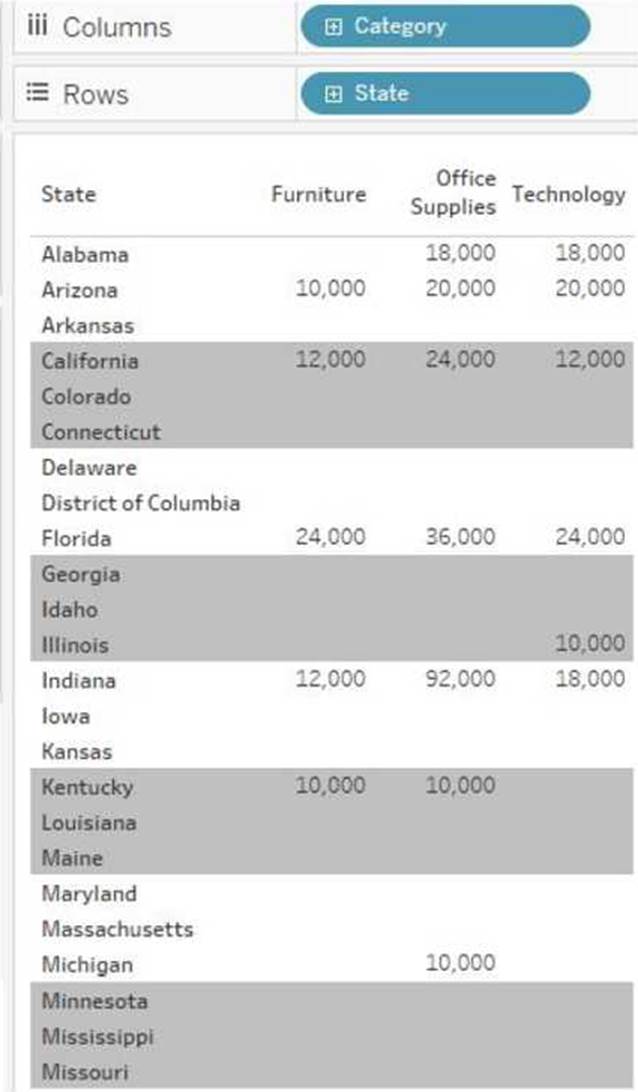
You need each record to alternate between grey and white.
What should you change in the Format Shading pane?
- A . the row banding size to 1
- B . the column banding size to 1
- C . the row banding size to 3
- D . the column banding size to 3
Open the link to Book1 found on the desktop. Open the Movie Durations worksheet.
Replace the existing data source with the Netflix_2019 data source.
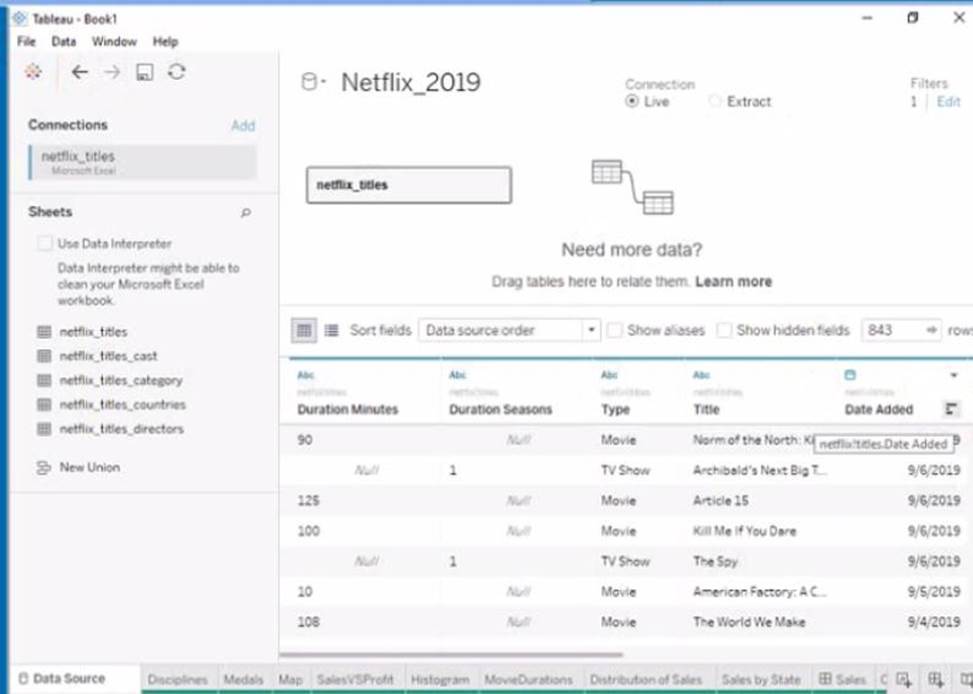
Open the link to Book1 found on the desktop. This will open the Tableau workbook that contains the Movie Durations worksheet.
Click on the Movie Durations tab at the bottom of the workbook to open the worksheet. You will see a bar chart that shows the number of movies by duration for the existing data source.
Go to the Data Source tab at the bottom of the workbook to see the data source page. You will see a table that shows the fields and values from the existing data source.
Click on the drop-down arrow next to the data source name at the top of the page and select Replace Data Source from the menu. This will open a dialog box that allows you to replace your data source with another one.
Select Netflix_2019 from the list of available data sources and click OK. This will replace your existing data source with the Netflix_2019 data source and update your worksheet accordingly. You may need to fix any broken fields or calculations that result from the replacement.
Reference:
https://help.tableau.com/current/pro/desktop/en-us/datasource_replace.htm https://help.tableau.com/current/pro/desktop/en-us/datasource_replace_workbook.htm
You have the following dataset that contain null values in the Profits field.
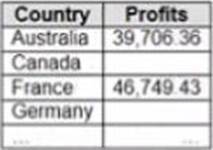
You want the data to appear as shown in the following table.
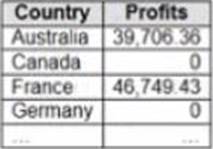
Which two formulas achieve the goal? Choose two.
- A . 2N ([Profits])
- B . ISNULL ([Profits])
- C . IFNULL [(profits] ,0)
- D . IF [Profits] != null then [Profits] END
AC
Explanation:
The two formulas that will make the data appear as shown in the second table are:
C. IFNULL([Profits],0)
D. IF [Profits] != null then [Profits] END
The IFNULL function is a logical function that returns the first argument if it is not null, and the second argument if it is null. In this case, the first argument is [Profits], which is the field that contains null values. The second argument is 0, which is the value that you want to replace null values with. The function will return [Profits] if it is not null, and 0 if it is null.
The IF statement is a logical statement that returns a value or performs an action if a condition is true, and optionally returns another value or performs another action if the condition is false. In this case, the condition is [Profits] != null, which means that [Profits] is not null. The statement will return [Profits] if the condition is true, and nothing if the condition is false. The END keyword marks the end of the statement.
The other options are not correct for this scenario. The ZN function is a logical function that returns zero if a value or expression is null, and returns the value or expression itself if it is not null. However, it only works with numeric values or expressions, and [Profits] may not be numeric in this case. The ISNULL function is a logical function that returns TRUE if a value or expression is null, and FALSE otherwise. It does not replace null values with another value.
Reference:
https://help.tableau.com/current/pro/desktop/en-us/functions_functions_logical.htm#IFNULL
https://help.tableau.com/current/pro/desktop/en-us/functions_functions_logical.htm#IF
https://help.tableau.com/current/pro/desktop/en-us/functions_functions_logical.htm#ZN
https://help.tableau.com/current/pro/desktop/en-us/functions_functions_logical.htm#ISNULL
HOTSPOT
You have the following dashboard.
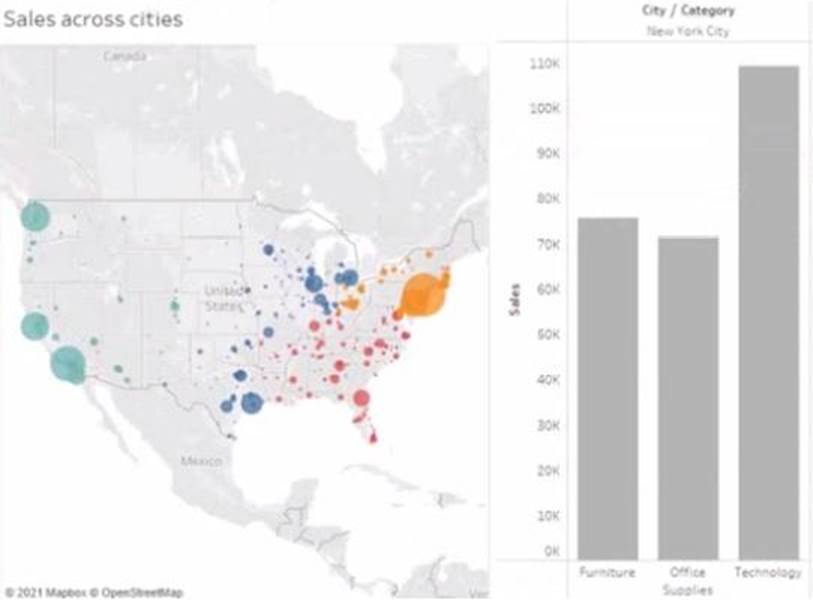
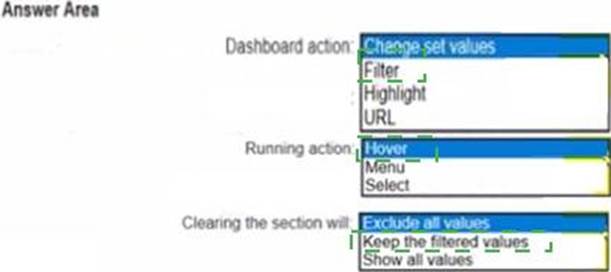
When a user selects a only on the map the data on the bar chart must show only the data for the selected city. The data in the bar chart must change only when the user selects a different city.
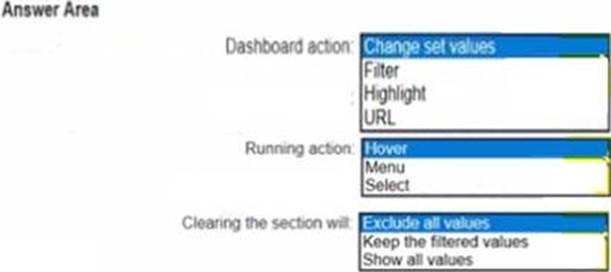
How should you configure the dashboard action? (Use the dropdowns in the Answers Area to select the correct options.)
Explanation:
To configure the dashboard action, you should select Filter as the action type, Select as the run action on option, and All Fields as the target filters option. This will ensure that when a user selects a city on the map, the bar chart will show only the data for the selected city based on all fields in common between the two worksheets. The action will run only when the user selects a different city.
Reference:
https://help.tableau.com/current/pro/desktop/en-us/actions.htm https://help.tableau.com/current/pro/desktop/en-us/actions_filter.htm
You create the following story that contains two story point.
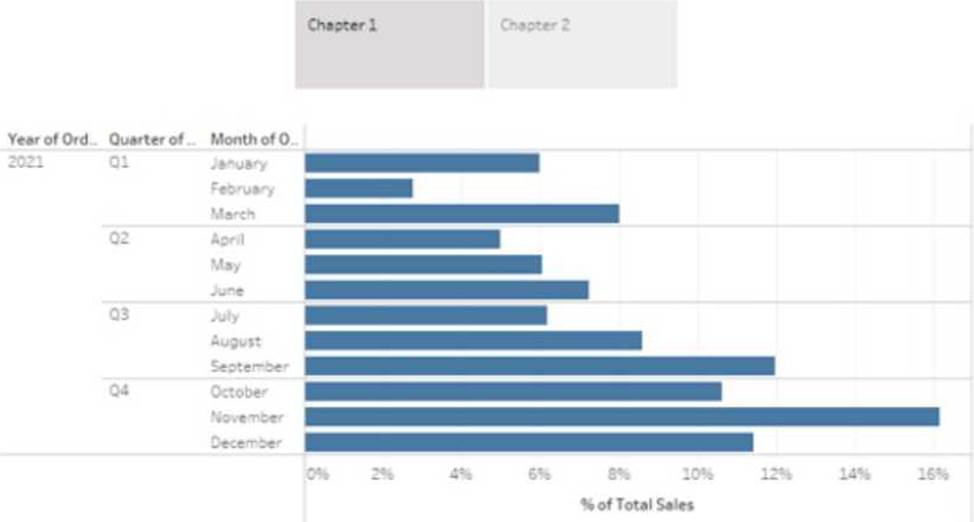
You want to change the story point format to show the current story point number out of the total number of story points.
Which Layout option should you use?
- A . Dots
- B . Arrows only
- C . Caption boxes
- D . Numbers
D
Explanation:
To change the story point format to show the current story point number out of the total number of story points, you should use the Numbers option in the Layout tab. This option will display the story points as numbers in a horizontal or vertical sequence, such as 1/2, 2/2. You can also choose to show or hide the next and previous arrows for navigation. The Numbers option will help you indicate the progress and order of your story points more clearly than the other options.
Reference: Creating a Story – Tableau
New in 9.0: Formatting the Story Points Navigator – Tableau Tableau Certified Data Analyst Study Guide