
Practice Free TDA-C01 Exam Online Questions
HOTSPOT
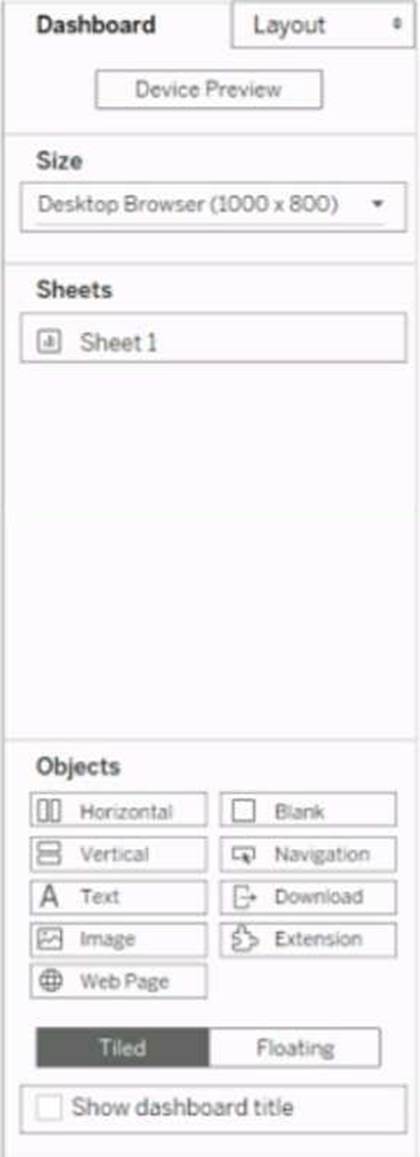
You have a dashboard that is configured for desktop browsers.
You want to customize a layout for mobile users.
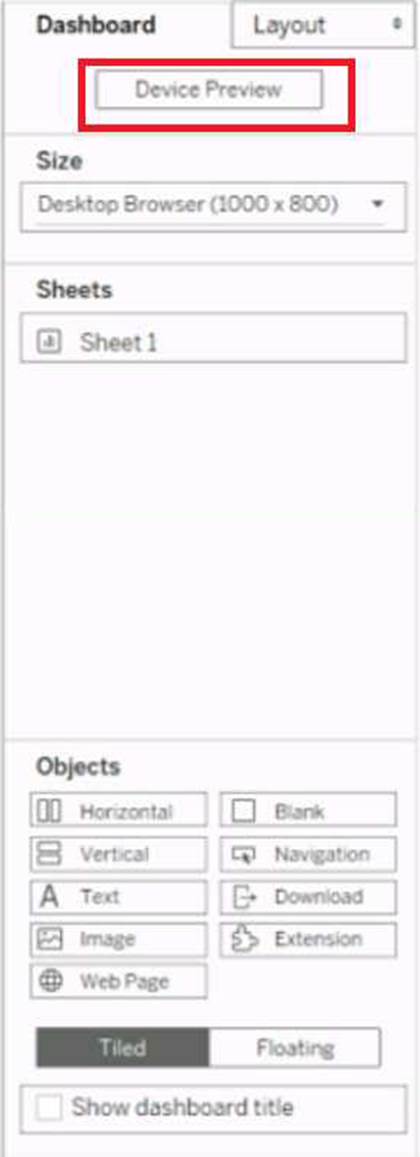
Which option should you select first? (Click the appropriate Option in the Answer Area.)
Explanation:
To customize a layout for mobile users, you should select the Device Preview option first. This option will allow you to see how your dashboard will look on different types of devices, such as phones, tablets, or desktops. You can also choose different models and orientations to preview different screen sizes and resolutions. From the Device Preview mode, you can add, edit, or delete device layouts for each device type. You can also adjust the size, position, and formatting of the dashboard elements for each device layout.
Reference: Create Dashboard Layouts for Different Device Types – Tableau Tableau Certified Data Analyst Study Guide
You connect to a database server by using Tableau Prep. The database server has a data role named Role1.
You have the following field in the data.

You need to apply the Role1 data role to the Material field.
Which two actions should you perform? Choose two.
- A . From the More actions menu of Materials, select Valid in the Show values section.
- B . For the data type of the Material field, select Custom, and then select Role1.
- C . From the More actions menu of Materials, select Group Values, and then select Spelling.
- D . From the More actions menu of Materials, filter the selected values.
BC
Explanation:
To apply a custom data role to a field, you need to select the data type of the field and then choose the data role from the list of available roles. This will validate the values in the field against the data role and mark any invalid values with a red exclamation mark. To fix the invalid values, you can use the Group Values option and select the Spelling algorithm, which will group values that are close in spelling and replace them with the most frequent value in the group. This will help you standardize the values in the Material field and match them with the Role1 data role.
Reference:
The information is based on the following sources:
Use Data Roles to Validate your Data – Tableau
New in Tableau Prep: Automatically identify data quality issues with Data Roles
HOTSPOT
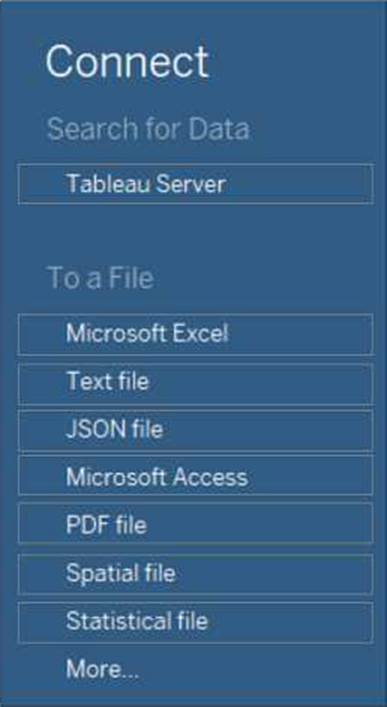
You receive a tab-delimited data file name sales.tsv.
You need to connect to the file.
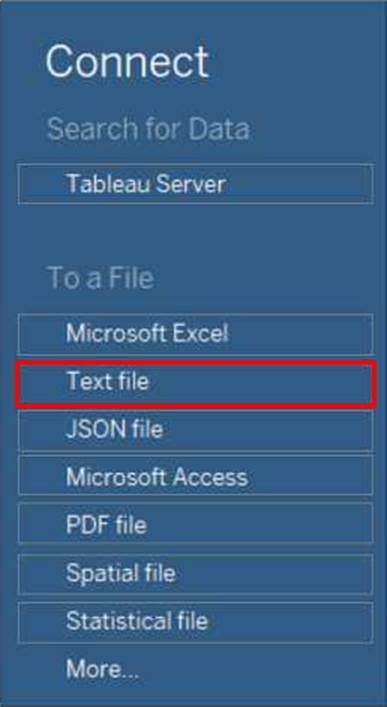
Which option should you select in Tableau Desktop?
Explanation:
To connect to a tab-delimited data file named sales.tsv, you should select the option To a File > Text file in Tableau Desktop. This option will allow you to browse and select the file from your local or network drive and connect to it as a data source. You can then specify the text file properties, such as the delimiter, the text qualifier, and whether the first row contains column names. You can also join, union, or blend the data with other data sources if needed.
Reference: Text File – Tableau
Tableau Certified Data Analyst Study Guide
DRAG DROP
You company has two divisions located in the United States and Germany Bach division has a separate database. The following is a sample of the sales data for the division in the United States.

The following is a sample of the sales data for me division in Germany.

You have population data in a file named Populatio.csv. the following is a sample of the data.
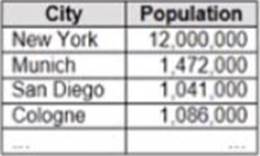
You plan to create a visualization that ml show tie sales per capita for each salesperson Each salesperson must be identified by identified by their full name.
You need to prepare the data to support the planned visualization. The data source must support being published.
Which four actions should you perform in order?
(Place the four correct options n order Use the arrows to move Options to Answer Area arrows to re-order the options.
Use Answer Area arrows to re-order the options)


Explanation:
The correct order of the four actions is:
Open Tableau Prep
Create a new column to concatenate the name for the Germany division
Union the sales data of both divisions
Join the sales data and the population data by using Country as the join field
The first action is to open Tableau Prep, which is a tool that allows you to prepare and shape your data for analysis. You can connect to various data sources, clean and transform your data, and output it to Tableau Desktop or Tableau Server.
The second action is to union the sales data of both divisions, which means appending them together. This will create a single table that contains all the rows from both tables, with null values for any missing fields. You can use the Union step in Tableau Prep to drag and drop your tables and create a union.
The third action is to create a new column to concatenate the name for the Germany division, which means combining the first name and last name into one field. This will make it consistent with the name field in the United States division, and allow you to identify each salesperson by their full name. You can use the Clean step in Tableau Prep to create a calculated field that uses the CONCAT function to join the two fields.
The fourth action is to join the sales data and the population data by using Country as the join field, which is a common field between them. This will add the population data for each country to the sales data, which is needed to calculate the sales per capita. You can use the Join step in Tableau Prep to drag and drop your tables and choose the join type and fields.
Reference:
https://help.tableau.com/current/prep/en-us/prep_get_started.htm
https://help.tableau.com/current/prep/en-us/prep_union.htm
https://help.tableau.com/current/prep/en-us/prep_clean.htm
https://help.tableau.com/current/prep/en-us/prep_join.htm
You publish a dashboard that uses an extract. The extract refreshes every Monday at 10:00.
You need to ensure that the extract also refreshes on the last day of the month at 18:00.
What should you do?
- A . From Tableau Server, select Schedules, find the schedule of the extract, and change the frequency to the last day of the month.
- B . From Tableau Server, select Schedules, and change the priority of the existing schedule.
- C . From Tableau Server, select the workbook, select Refresh Extracts, and then add a new extract refresh.
- D . From Tableau Desktop, open the Publish Workbook dialog box and configure the schedule.
C
Explanation:
To ensure that the extract also refreshes on the last day of the month at 18:00, you need to add a new extract refresh task to the workbook on Tableau Server. You can do this by selecting the workbook, selecting Refresh Extracts, and then choosing Schedule a Refresh. You can then select an existing schedule that matches your desired frequency and time, or create a new schedule with a custom frequency and time. This will add a new extract refresh task to the workbook, in addition to the existing one that refreshes every Monday at 10:00. You can also modify or delete the extract refresh tasks as needed.
Reference: Tableau Certified Data Analyst Exam Prep Guide, page 10, section “Publishing and Scheduling Data Refreshes”
Tableau Help: Refresh Data on a Schedule
Tableau Help: Manage Refresh Tasks
You have a data source that contains 20 tables.
You want the tables to be organized within the Data pane based on the type of data contained within the tables.
What should you use?
- A . Folders
- B . Hierarchies
- C . Sets
- D . Groups
A
Explanation:
To organize the tables in the Data pane based on the type of data contained within the tables, you should use folders. Folders are a way to manually group fields, parameters, sets, or tables in the Data pane according to your preference. You can create folders by right-clicking on the fields or tables you want to group and selecting Folders > Create Folder. You can also drag and drop fields or tables into existing folders. You can name the folders according to the type of data they contain, such as sales, customer, product, etc. Folders can help you find and access the fields or tables you need more easily and efficiently.
Reference: Organize and Customize Fields in the Data Pane – Tableau Tableau Certified Data Analyst Study Guide
You have the following primary data source that contains a dimension named Dorm_Code.
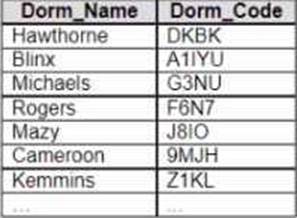
You receive the following secondary data source that contains updated dorm codes.
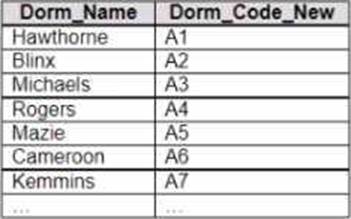
You need to bring the updated dorm codes into Tableau and use the codes in existing visualizations.
The new dorm codes must use the existing field name of Dorm_Code.
What should you do?
- A . Bring in the secondary data source as a union.
- B . Bring in the secondary table as a left join to the primary data source. From the Data Source page, select Create Calculated Field in the Dorm_Name field and enter [Dcrm_Name_New] in the calculation window
- C . Bring in the secondary data source by using relationships. From the Data pane, right-click Dorm_Name select Replace Reference, and then select Dorm_Name_New
- D . Create a data blend and select Edit Primary Aliases to replace the primary data source alias values with values from the secondary data source
C
Explanation:
Using relationships: You can use relationships to link the secondary data source with the primary data source based on a common field. This will allow you to use fields from both data sources in your visualization without creating new fields or duplicating data. You can then replace references to update the dimension values. For example, you can use relationships to link the updated dorm codes with the primary data source and then replace Dorm_Code with Dorm_Code_New in your visualization.
https://community.tableau.com/s/question/0D54T00000C5ldZSAR/update-data-view-based-on-dimension
In a dataset, you have a string field named Name that contains unnecessary semicolons.
Which function should you use to remove the semicolons from the Name field?
- A . TRIM
- B . CONTAINS
- C . REPLACE
- D . SPLIT
C
Explanation:
The REPLACE function is used to replace all occurrences of a substring within a string with another substring. In this case, it can be used to remove the semicolons from the Name field by replacing them with an empty string. For example, REPLACE (“John;Doe”, “;”, “”) = “JohnDoe”.
Reference: The information is based on the following sources:
String Functions – Tableau
Remove special characters and add a semi colon in a word – Tableau
You have a sales dataset that contains the following fields.
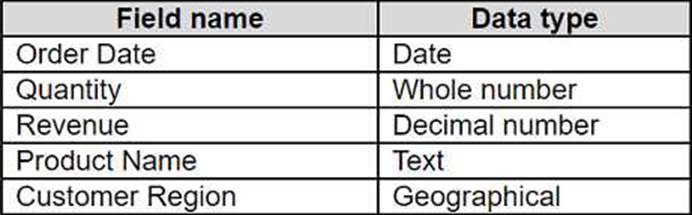
You need to analyze the average revenue per product in different regions over time.
Which two fields should be measures? Choose two.
- A . Customer Region
- B . Order Date
- C . Product Name
- D . Quantity
- E . Revenue
DE
Explanation:
To analyze the average revenue per product in different regions over time, you need to use two fields that contain numeric, quantitative values that you can measure and aggregate. Quantity and Revenue are both measures that fit this criterion. You can multiply Quantity and Revenue to get the total sales for each product, and then divide by the number of products to get the average revenue. You can also use these measures to create charts and tables that show the trends and comparisons over time and across regions.
Reference: Dimensions and Measures, Blue and Green – Tableau
Tableau Certified Data Analyst Study Guide
Open the link to Book1 found on the desktop. Open Disciplines worksheet.
Filter the table to show the Top 10 NOC based on the number of medals won.
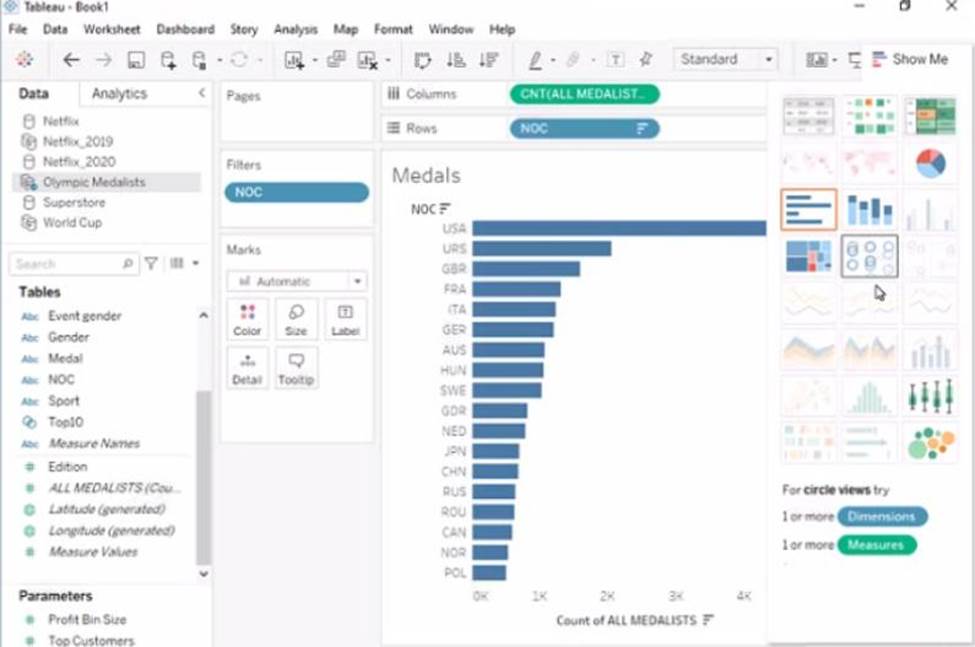
Open the link to Book1 found on the desktop. This will open the Tableau workbook that contains the Disciplines worksheet.
Click on the Disciplines tab at the bottom of the workbook to open the worksheet. You will see a table that shows the NOC, discipline, and medals for each country.
Drag Medals from the Measures pane to the Filters shelf. This will open a dialog box that allows you to filter by different criteria.
Select Top from the dialog box. This will show you options to filter by the top or bottom values of a field.
Enter 10 in the text box next to By field. This will filter by the top 10 values of Medals.
Select NOC from the drop-down list next to By field. This will filter by the top 10 values of NOC based
on Medals.
Click OK to apply the filter. You will see that the table now shows only 10 rows, one for each NOC with the highest number of medals.
Reference:
https://help.tableau.com/current/pro/desktop/en-us/filtering.htm
https://help.tableau.com/current/pro/desktop/en-us/filtering_topn.htm