
Practice Free SD-WAN-Engineer Exam Online Questions
What are two potential causes when a secondary public circuit has been added to the branch site, but the Prisma SD-WAN tunnel is not forming to the data center? (Choose two.)
- A . Interface role is not selected as “internet.”
- B . Circuit label is missing from interface type.
- C . DNS is not configured.
- D . Interface scope is set to “local.”
A, B
Explanation:
In a Prisma SD-WAN deployment, the formation of VPN tunnels between a branch ION device and a Data Center (DC) ION is governed by specific configuration parameters that define how an interface interacts with the WAN fabric. When a secondary public circuit is introduced, the system requires precise classification to initiate the negotiation of security associations.
The first critical factor is the Interface Role. For an ION device to attempt to build a global fabric tunnel over a public circuit, the interface must be explicitly assigned the "Internet" role. If the role is incorrectly set (e.g., as "LAN" or left unconfigured), the device will not treat that physical port as a viable path for the SD-WAN overlay, preventing the tunnel from initiating.
Secondly, the Circuit Label plays a vital role in the path selection and tunnel orchestration logic. Prisma SD-WAN uses labels to match local branch circuits with corresponding circuits at the data center or other branches. If a circuit label is missing or mismatched on the interface configuration, the Controller cannot properly orchestrate the "bind" between the branch and the hub. Without a valid label, the ION device doesn’t know which path group the circuit belongs to, and consequently, the automated tunnel signaling process fails to complete.
While DNS is important for management connectivity to the Controller, it is generally not the primary blocker for site-to-site tunnel formation if the Controller reachability is already established via the primary circuit. Similarly, "Interface Scope" is more relevant to routing advertisement rather than the foundational establishment of the SD-WAN tunnel itself. Therefore, ensuring the Internet role and Circuit Label are correctly applied is the standard troubleshooting step for non-forming tunnels on new circuits.
Which troubleshooting action should be taken when resources at one branch site can reach the internet but cannot be reached from the data center (DC)?
- A . Create static route with DC ION as a next hop.
- B . Ensure the LAN branch prefixes are set to “global.”
- C . Set the site in a control mode.
- D . Admin up the Prisma SD-WAN DC endpoints.
B
Explanation:
In the Prisma SD-WAN architecture, reachability between sites is managed by the Control Plane, which automatically advertises prefixes across the secure fabric based on their scope. If a branch site has successful Direct Internet Access (DIA) but is invisible to the Data Center (DC), it indicates that while the local ION is online, its internal network information has not been propagated to the rest of the SD-WAN fabric.
The most common cause for this behavior is that the LAN interfaces or static routes at the branch are configured with a Local scope rather than a Global scope. When a prefix is set to "Local," the ION device treats that network as reachable only within that specific site; it will not advertise that prefix to the Controller for distribution to other ION devices, such as those at the Data Center. By ensuring the LAN branch prefixes are set to "global" (Option B), the administrator instructs the ION device to share these routes with the global fabric.
Once the prefix is marked as global, the Prisma SD-WAN Controller identifies it as a reachable destination and updates the routing tables of all peer ION devices in the same domain, including the DC gateways. This allows the Data Center to build a valid path to the branch resources over the secure VPN tunnels.
Options like creating static routes (Option A) or changing site modes (Option C) do not address the fundamental requirement of prefix advertisement within the software-defined fabric, which relies on correctly defined metadata like route scope.
Which condition, when configured within a performance policy, is a trigger for generating an incident related to application performance or path degradation?
- A . Violation of defined service-level agreement (SLA) thresholds for application performance or link quality.
- B . Exceeding the configured threshold for total concurrent flows in the ION device, resulting in a SYSTEM_CONCURRENT_FLOW_THRESHOLD_EXCEEDED incident.
- C . Loss of a BGP peering session on a data center ION device, leading to potential routing instability.
- D . Physical WAN interface transitioning from an “up” to a “down” state, resulting in a NETWORK_ANYNETLINK_DOWN event.
A
Explanation:
In Prisma SD-WAN, Performance Policies are the primary mechanism used to define the expected quality of experience for specific applications. Unlike traditional monitoring that relies solely on "up/down" interface states, Prisma SD-WAN focuses on the actual health of the application path. An incident is triggered when the system detects a violation of defined service-level agreement (SLA) thresholds, such as excessive latency, jitter, or packet loss, even if the physical link remains active.
When an administrator configures a performance policy, they set specific bounds for these metrics. For example, a VoIP application might have an SLA requiring latency below 150ms and packet loss below 1%. If the ION device detects that the current path (e.g., a broadband circuit) exceeds these limits, it generates a performance incident. This incident serves two purposes: first, it alerts the administrator to the degradation; second, it triggers the Path Selection engine to proactively steer the application traffic to a more suitable "Backup" or "Available" path that currently meets the SLA requirements.
Options B, C, and D represent system-level or network-level events that generate different types of alerts or incidents (System or Network incidents), but they are not the triggers defined within a Performance Policy. Performance policies are specifically concerned with the application’s perceived performance across the fabric. By focusing on SLA violations rather than just physical link status, Prisma SD-WAN ensures that business-critical applications remain functional even during "brownout" conditions where a circuit is technically "up" but performing poorly.
Based on the HA topology image below, which two statements describe the end-state when power is removed from the ION 1200-S labeled “Active”, assuming that the ION labeled “Standby” becomes the active ION? (Choose two.)
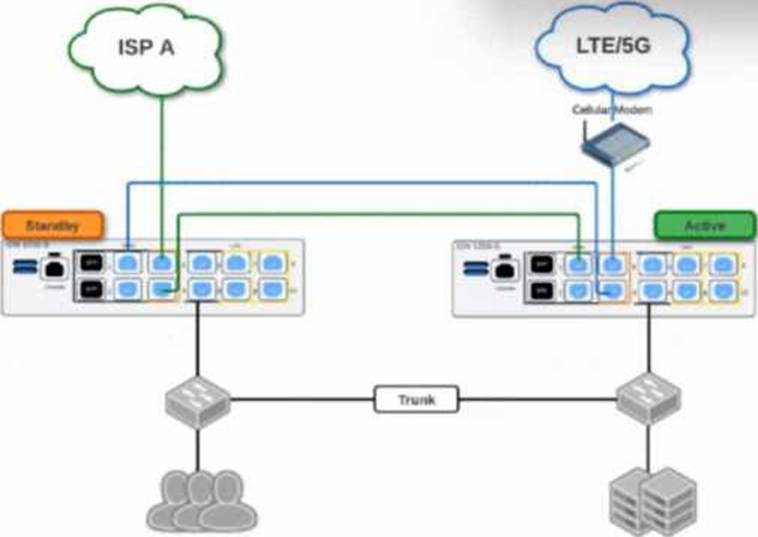
- A . Both the connection to ISP A and the connection to LTE/5G will be usable.
- B . The VRRP Virtual IP address assigned to any SVIs will be moved to the newly active ION.
- C . The newly active ION will send a gratuitous ARP to the LAN for the IP address of any SVIs.
- D . The connection to ISP A will be usable, but the connection to LTE/5G will not.
A, C
Explanation:
Comprehensive and Detailed Explanation
This scenario depicts a High Availability (HA) topology utilizing the ION 1200-S model’s Fail-to-Wire (bypass) capabilities to share WAN links between two devices without needing external switches for every WAN connection.
What does Prisma SD-WAN use for monitoring and operations to deliver flow data and application visibility?
- A . ADEM
- B . IPFIX
- C . SNMPv3
- D . IP SLA
B
Explanation:
Prisma SD-WAN is built on an application-defined fabric that prioritizes deep visibility into network traffic and application performance.1 To deliver the high-fidelity flow data and application visibility required for modern operations, Prisma SD-WAN utilizes IPFIX (Internet Protocol Flow Information Export).2 IPFIX is a standardized protocol based on NetFlow v9 that allows for the export of IP flow information from network devices to a collector or management system.3
In the Prisma SD-WAN architecture, ION devices act as the exporters.4 Because the system is application-aware, it doesn’t just export basic 5-tuple information (source/destination IP, ports, and protocol); it exports rich metadata including application IDs, performance metrics (latency, jitter, packet loss), and path information. This allows the Prisma SD-WAN Controller and the associated Analytics engine to reconstruct a complete picture of every flow in the network.
While other protocols like SNMPv3 are supported for basic device health monitoring (such as CPU or interface status) and ADEM (Autonomous Digital Experience Management) provides end-to-end visibility for mobile users or SASE-connected branches, IPFIX is the primary "engine" for flow-level data across the SD-WAN fabric. Unlike traditional IP SLA, which relies on synthetic probes, the IPFIX-based monitoring in Prisma SD-WAN uses real-time application traffic to assess performance. This ensures that the visibility provided in the Flow Browser and Analytics dashboards accurately reflects the actual user experience, enabling granular troubleshooting and proactive capacity planning.
When allocating Aggregate Bandwidth for a Prisma Access "Remote Network" deployment (connecting 50 branch sites), how is the bandwidth license enforced?
- A . Each branch site is hard-capped at the specific bandwidth limit defined in its individual IPSec tunnel configuration.
- B . The bandwidth is shared as a pool across all sites in a specific Compute Location (Region); individual sites can burst up to the available pool capacity.
- C . The bandwidth is allocated per device serial number and cannot be shared.
- D . The bandwidth license is only checked once during the initial onboarding; there is no ongoing enforcement.
B
Explanation:
Comprehensive and Detailed Explanation
Prisma Access manages Remote Network bandwidth using an Aggregate Bandwidth licensing model.
Compute Locations: When you purchase bandwidth (e.g., 1 Gbps), you allocate it to specific Prisma Access Compute Locations (e.g., US West, Europe Central).
Shared Pool: All branch sites (Remote Networks) that connect to that specific Compute Location share the allocated bandwidth pool. For example, if you allocate 500 Mbps to "US West" and connect 10 branches to it, they compete for that 500 Mbps aggregate.
Bursting: An individual branch is not strictly rate-limited to a "slice" (e.g., 50 Mbps) unless you explicitly configure QoS guarantees. By default, a single branch can burst and consume a large portion of the aggregate pool if other branches are idle. The enforcement happens at the Region/Compute Node level, ensuring the total throughput does not exceed the licensed capacity for that region.
Which component of the Prisma SD-WAN solution is responsible for the deep application identification (App-ID) and the generation of flow metrics (Network Transfer Time, Server Response Time) at the branch?
- A . The CloudBlade container
- B . The Prisma SD-WAN Controller
- C . The ION Device Data Plane
- D . The API Gateway
C
Explanation:
Comprehensive and Detailed Explanation
The ION Device Data Plane (the software running locally on the hardware appliance at the branch) is the component responsible for the heavy lifting of traffic analysis.
Edge Processing: Prisma SD-WAN uses an "Application-Defined" architecture. The ION device performs Deep Packet Inspection (DPI) on the first few packets of a flow to identify the application (e.g., distinguishing "Skype Video" from "Skype Chat").
Metric Calculation: The ION device timestamping engine calculates the performance metrics (RTT, NTT, SRT) in real-time as packets pass through its interfaces. It aggregates this metadata.
Role of Controller (B): The Controller collects and visualizes this data (Analytics), but it does not generate it. The Controller does not sit in the data path of the user traffic. If the ION relied on the controller for App-ID, latency would be unacceptably high. Therefore, all detection and metric generation happens locally on the ION Device.
There are periodic complaints about the poor performance of a real-time application.
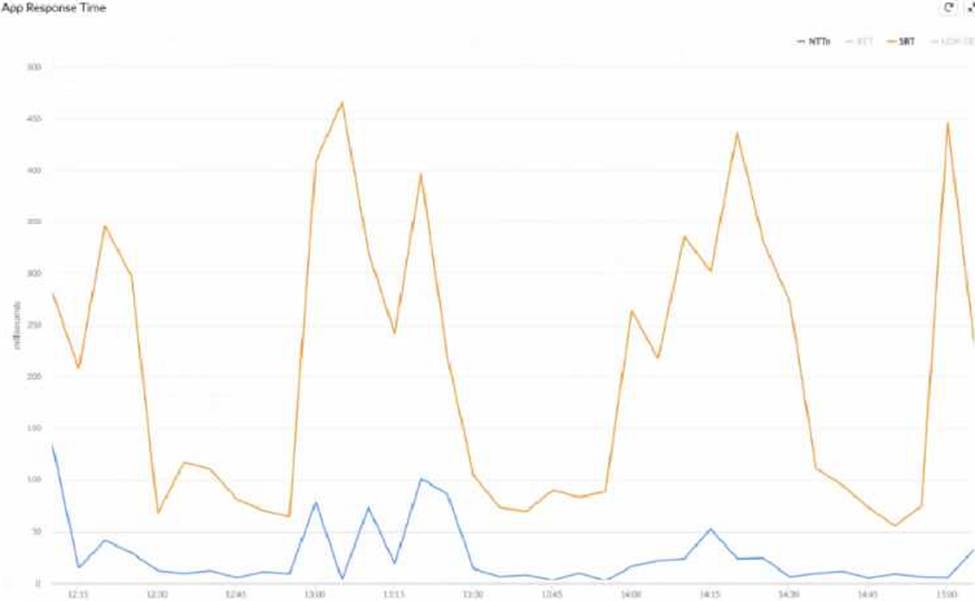
What can be inferred about the performance issue, based on the Network Transfer Time (NTT) and Server Response Time (SRT) image below?
- A . The NTT value increases periodically resulting in higher SRT.
- B . The NTT value drops periodically due to network related issues.
- C . The SRT value increases periodically due to Application Server side issues.
- D . The SRT value drops periodically due to Application Server side issues.
C
Explanation:
In Prisma SD-WAN, application performance is monitored through distinct metrics that separate network health from application health. The provided graph displays Network Transfer Time (NTT) in blue and Server Response Time (SRT) in orange. NTT measures the round-trip time of packets traversing the WAN fabric, while SRT measures the time elapsed from when the server receives a request to when it sends the first response packet.
Analysis of the telemetry data shows that the NTT (blue line) remains consistently low and stable, generally staying below 100 milliseconds throughout the capture period. This indicates that the SD-WAN path and underlying network circuits are not the source of the latency. Conversely, the SRT (orange line) exhibits significant and erratic spikes, reaching as high as 450 to 475 milliseconds. These spikes occur while the network latency (NTT) remains flat.
Because the latency increases are isolated to the SRT metric, the root cause is confirmed to be on the Application Server side. This pattern typically suggests that the server is struggling with resource exhaustion, high CPU utilization, or database query delays during peak processing times. For a real-time application, these SRT spikes translate directly to jitter and "lag" for the end-user. By distinguishing between these two metrics, Prisma SD-WAN allows network administrators to prove that the network is performing within SLA and shift the troubleshooting focus to the application or server management teams, significantly reducing mean time to innocence (MTTI).
When defining a Path Quality Profile (SLA) for a "Transactional" application group (e.g., Citrix, Oracle), the administrator sets the "Packet Loss" threshold to 1%.
What happens to the traffic for this application if all active paths currently exceed this 1% loss threshold?
- A . The traffic is dropped to prevent data corruption.
- B . The system selects the best available path (lowest loss) among the active paths, even if it violates the profile.
- C . The traffic is queued indefinitely until a path recovers.
- D . The system automatically enables a Backup path, even if the Active paths are technically "Up" but degraded.
B
Explanation:
Comprehensive and Detailed Explanation
This behavior describes the "Best Available Path" logic inherent in Prisma SD-WAN’s availability design.
SLA Thresholds: Path Quality Profiles act as filters to identify compliant paths.
Total Violation: If all configured "Active" paths violate the SLA (e.g., Path A has 2% loss, Path B has 5% loss, and the threshold is 1%), the system does not drop the traffic (Option A) because maintaining connectivity is prioritized over perfect quality.
Selection Logic: The system enters a fallback state where it compares the available active paths and selects the "Least Bad" one―the path that is closest to meeting the SLA (in this case, Path A with 2% loss).
Backup Paths: Traffic would only move to a Backup path (Option D) if the policy explicitly configures the backup path to engage upon SLA violation of the active set. However, strictly speaking, if only active paths are considered and all fail, it picks the best of the active group rather than blackholing the traffic.