
Practice Free SD-WAN-Engineer Exam Online Questions
What is the primary function of the "CloudBlade" platform in a Prisma SD-WAN deployment when integrating with third-party services or Prisma Access?
- A . It acts as a physical line card on the ION device to provide additional 10Gbps interfaces.
- B . It is a containerized application running on the ION device that performs Deep Packet Inspection (DPI).
- C . It is a cloud-based API integration layer that automates the configuration of the ION devices and the remote service.
- D . It is a monitoring dashboard used exclusively for viewing flow records.
C
Explanation:
Comprehensive and Detailed Explanation
The CloudBlade platform is a distinguishing architectural component of the Prisma SD-WAN solution. It is not a physical piece of hardware, nor is it software that runs directly on the branch ION device’s CPU.
Instead, the CloudBlade platform is a cloud-based API integration layer hosted by Palo Alto Networks. It functions as an intelligent broker or "translator" between the Prisma SD-WAN Controller and external third-party services (such as Prisma Access, Amazon Web Services, Azure, ServiceNow, or Zscaler).
When an administrator configures the Prisma Access CloudBlade, for example, they input their API credentials and intent (e.g., "Connect all US branches to US West"). The CloudBlade engine then:
Communicates with the Prisma Access API to provision the remote IPSec termination nodes (Security Processing Nodes).
Translates this configuration into specific instruction sets for the Prisma SD-WAN Controller.
The Controller then pushes the necessary VPN tunnel configurations, IKE parameters, and routing rules to the relevant ION devices.
This architecture eliminates the need for manual IPSec configuration on every branch device. It ensures that if the third-party service changes its IP addresses or settings, the CloudBlade can detect the change via API and automatically update the branch fleet, maintaining connectivity without manual administrator intervention.
A network operator receives a critical SITE_CONNECTIVITY_DOWN alarm for a branch site in the Prisma SD-WAN portal.
What specific condition triggers this alarm type?
- A . The device has lost power and rebooted.
- B . One of the two internet circuits at the site has gone down.
- C . All Secure Fabric Links (VPNs) to all remote peers are down, isolating the site from the overlay.
- D . The site has exceeded its licensed bandwidth capacity.
C
Explanation:
Comprehensive and Detailed Explanation
The SITE_CONNECTIVITY_DOWN alarm is a high-severity alert indicating a total loss of overlay connectivity for a site.
It does not trigger if just one circuit fails (Option B), provided that other circuits are still up and maintaining VPNs. A single link failure would typically trigger a "Link Down" or "VPN Down" alarm,
but the Site connectivity would remain "Up" (degraded).
It does not simply mean the device rebooted (Option A), although a reboot would cause it temporarily; the alarm specifically tracks the state of the VPN fabric.
The SITE_CONNECTIVITY_DOWN alarm specifically generates when all Secure Fabric Links (VPN tunnels) on the device are in the "Down" state. This means the branch is completely isolated from the rest of the SD-WAN network (Data Centers and other branches), even if the device itself might still be powered on and reachable via the controller (management plane). It signifies a "Blackout" of the data plane for that location.
Full discovery and classification of IoT devices by the IoT Security service is failing.
Which Prisma SD-WAN ION device configuration will cause this behavior?
- A . The ION devices are missing DHCP Configuration. If ION devices are not explicitly configured as either a DHCP relay agent or a DHCP server, DHCP traffic logs will not be sent to the Strata Logging Service, resulting in incomplete device profiles for IoT Security.
- B . The Prisma SD-WAN ION devices lack properly configured or enabled Service Health Probes specifically targeting the IoT device subnets. Without these active probes, the system cannot gather critical real-time reachability and performance metrics essential for dynamic device profiling and classification.
- C . The Syslog export configuration on the ION devices to the Strata Logging Service has filters that are too restrictive, potentially excluding logs vital for IoT Security’s device identification and classification engine. This prevents comprehensive event data, including device discovery messages, from reaching the portal.
- D . The ION devices are not configured to explicitly enable and export IPFIX flow records, especially those containing Layer 2 and Layer 7 context, to the Strata Logging Service for IoT Security. While ARP data is sent by default, comprehensive device classification relies on these detailed flow records, which are not being captured.
A
Explanation:
Palo Alto Networks IoT Security relies on rich metadata and traffic logs to identify, classify, and secure devices across the network. A critical component of this discovery process is the ingestion of DHCP (Dynamic Host Configuration Protocol) traffic. DHCP packets contain vital information about a device, such as the MAC address, vendor-specific identifiers (Option 60), and hostnames, which are used by the machine learning engine to create a precise device profile.
In a Prisma SD-WAN environment, if the ION devices are not involved in the DHCP process, the necessary logs cannot be forwarded to the Strata Logging Service (SLS) for analysis by the IoT Security cloud. To ensure successful discovery, the ION device at the branch must be explicitly configured as either the DHCP Server for the local segment or as a DHCP Relay Agent. When the ION handles DHCP traffic, it automatically extracts and sends the relevant metadata to the cloud.
If the ION is bypassed―for example, if a local Layer 3 switch is handling DHCP internally without relaying it to the ION―the IoT Security service will lack the context needed to move beyond basic IP-level visibility. Without these DHCP-derived "fingerprints," the system cannot perform the full classification required to apply granular security policies or identify potential vulnerabilities. Therefore, verifying that the ION device is correctly integrated into the DHCP lifecycle is the primary troubleshooting step for incomplete IoT device discovery in the Prisma SD-WAN portal.
Which component of Prisma SD-WAN is responsible for distributing User-IP and user-group mappings to branch devices that match the corresponding source IPs?
- A . DC ION
- B . Cloud Identity Engine
- C . Controller
- D . NGFW
C
Explanation:
In the Prisma SD-WAN architecture, the Controller serves as the centralized management and control plane for the entire fabric. While the Cloud Identity Engine (CIE) is the component responsible for collecting and consolidating user-to-IP mappings from various identity providers (such as Active Directory, Okta, or Azure AD), it does not directly manage the distribution of this operational data to the individual ION devices at the branch level.
Instead, the Prisma SD-WAN Controller integrates with the Cloud Identity Engine to ingest these identity mappings. Once the Controller has synchronized the User-IP and user-group information, it acts as the primary orchestrator. It is responsible for distributing these mappings down to the ION devices across all sites. This distribution ensures that when an ION device sees traffic from a specific source IP, it can accurately associate that traffic with a specific user or group based on the metadata provided by the Controller.
By centralizing this distribution through the Controller, Prisma SD-WAN ensures consistency across the network. Branch ION devices can then apply Application-Based Path Selection and security policies based on user identity rather than just IP addresses. This architectural design offloads the processing requirements of maintaining direct connections to identity providers from the branch hardware, allowing the Controller to handle the heavy lifting of orchestration and global synchronization of identity data.
Based on the HA topology image below, which two statements describe the end-state when power is removed from the ION 1200-S labeled “Active”, assuming that the ION labeled “Standby” becomes the active ION? (Choose two.)
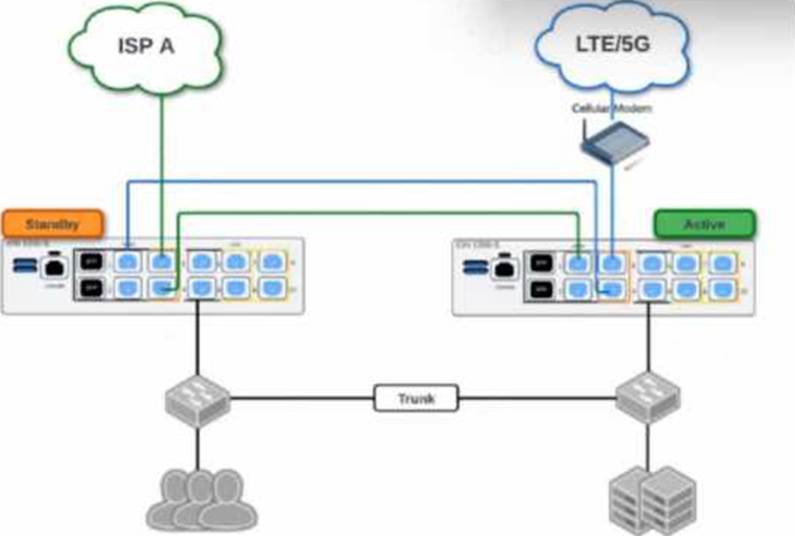
- A . Both the connection to ISP A and the connection to LTE/5G will be usable.
- B . The VRRP Virtual IP address assigned to any SVIs will be moved to the newly active ION.
- C . The newly active ION will send a gratuitous ARP to the LAN for the IP address of any SVIs.
- D . The connection to ISP A will be usable, but the connection to LTE/5G will not.
A, C
Explanation:
Prisma SD-WAN High Availability (HA) for branch ION devices, particularly the Gen-2 ION 1200-S, is designed to provide "100% WAN Capacity" preservation during a hardware or power failure. This is achieved through the use of Bypass Pairs (Fail-to-Wire). In the provided topology, the ISP A and LTE/5G circuits are cross-connected using the bypass ports (typically ports 3 and 4 on the ION 1200-S).
When the "Active" ION device loses power, the internal physical relays in its bypass ports transition to a closed state, effectively creating a physical bridge between the ports. In this scenario, the LTE/5G signal―which enters the Active ION’s port 4―is mechanically bridged to port 3, allowing it to pass through to port 4 of the Standby ION. Simultaneously, ISP A is already connected to the Standby ION. Consequently, once the Standby device completes its transition to the "Active" state, it has physical access to both WAN circuits, validating Statement A.
Regarding the LAN transition, Prisma SD-WAN does not use standard VRRP for ION-to-ION HA; instead, it uses a proprietary Control Plane HA mechanism. When the failover occurs, the newly active ION takes over the IP addresses of all configured Switch Virtual Interfaces (SVIs) and LAN interfaces. To ensure the downstream Layer 2 infrastructure (like the LAN switches shown in the diagram) updates its MAC address tables to point to the new physical hardware for those IPs, the newly active ION immediately broadcasts a Gratuitous ARP (GARP). This ensures that LAN traffic is correctly steered to the new device without a significant timeout, validating Statement C.
A customer wants to deploy Prisma SD-WAN ION devices at small home offices that use consumer-grade broadband routers. These routers typically use Symmetric NAT and do not allow static port forwarding.
Which standard mechanism does Prisma SD-WAN utilize to successfully establish direct Branch-to-
Branch (Dynamic) VPN tunnels through these Symmetric NAT devices?
- A . UPnP (Universal Plug and Play)
- B . STUN (Session Traversal Utilities for NAT)
- C . Manual GRE Tunnels
- D . SSL VPN encapsulation
B
Explanation:
Comprehensive and Detailed Explanation
Prisma SD-WAN utilizes STUN (Session Traversal Utilities for NAT) to facilitate NAT Traversal for its Secure Fabric overlay.
Discovery: When an ION device connects to the internet behind a NAT router, it reaches out to the Prisma SD-WAN Controller. The controller acts as a STUN server, identifying the public IP address and port that the ION’s traffic is originating from.
Symmetric NAT Challenge: In Symmetric NAT, the mapping changes for every destination. However, the Prisma SD-WAN architecture is designed to handle this by having the controller coordinate the connection attempt.
Hole Punching: The controller shares the discovered public mapping information between two peer ION devices. They then simultaneously initiate traffic to each other’s public IP/Port (a technique called "UDP Hole Punching"). This tricks the intermediate NAT devices into allowing the inbound traffic, establishing a direct P2P IPSec tunnel without requiring manual port forwarding or static IPs at the edge.
A network engineer is troubleshooting a "Voice Quality" issue. They suspect that the DSCP markings are being stripped or altered by the ISP.
Which tool in the Prisma SD-WAN portal allows the engineer to capture live packets on the WAN interface and inspect the IP header ToS/DSCP field?
- A . Flow Browser
- B . Packet Capture (PCAP)
- C . Path Quality Monitor
- D . Event Logs
B
Explanation:
Comprehensive and Detailed Explanation
To validate specific packet-level details like DSCP (Differentiated Services Code Point) values, header checksums, or exact payload sizes, a Packet Capture (PCAP) is required.
PCAP Tool: Prisma SD-WAN provides a built-in PCAP utility accessible directly from the portal. The engineer can select the specific Interface (e.g., Internet 1), apply a Filter (e.g., port 5060 or host 1.2.3.4), and capture the traffic.
Analysis: The resulting .pcap file can be downloaded and opened in Wireshark. This allows the engineer to definitively see if the packets leaving the ION have DSCP EF (46) and if the packets arriving (if capturing on the other side) still retain that marking, or if the ISP has bleached it to CS0 (0).
Flow Browser (A): While it shows "Application" and metrics, the Flow Browser typically displays the assigned priority class, not necessarily the raw bit-level DSCP value present in the packet header on the wire.
How can a network administrator detect a site outage or a service-level agreement (SLA) violation using controller-generated incidents?
- A . Incidents, SNMP traps, and audits
- B . Device logs, alerts, and incidents
- C . Incidents, alerts, statistics, and audit logs
- D . Priority alerts, informational alerts, and audit logs
C
Explanation:
In the Prisma SD-WAN ecosystem, the centralized cloud controller provides a robust multi-layered visibility framework to ensure network reliability. To effectively detect critical events like site outages or application performance issues (SLA violations), the controller aggregates several types of operational data. Incidents are the primary mechanism for high-level alerting; they are automatically generated when the system detects significant state changes, such as an ION device going offline (site outage) or a path failing to meet the required performance metrics.
While Incidents provide the "what" and "where," Alerts offer granular notifications for specific events that may not yet have escalated to a full-scale incident. To provide deep context, the controller also utilizes Statistics, which include real-time and historical telemetry regarding bandwidth, latency, jitter, and packet loss. These statistics allow administrators to visualize the specific SLA violation as it occurs. Furthermore, Audit logs are essential for tracking configuration changes or administrative actions that might have preceded an outage, helping engineers correlate human intervention with network behavior.
By combining these four elements―Incidents for major events, Alerts for specific notifications, Statistics for performance validation, and Audit logs for change tracking―a network administrator gains a 360-degree view of the fabric. This comprehensive approach moves beyond simple "up/down" monitoring, allowing for "Day 2" operational excellence where performance degradation is identified and remediated before it impacts the end-user experience.
An administrator needs to generate a monthly report showing the "Top Applications" by bandwidth usage across all branch sites to justify a bandwidth upgrade.
Which specific component of the Prisma SD-WAN interface is designed to create, schedule, and email these PDF summaries?
- A . Activity Charts
- B . Media Analytics
- C . Reports
- D . Flow Browser
C
Explanation:
Comprehensive and Detailed Explanation
Prisma SD-WAN separates real-time visibility from historical summarization.
Reports (C): The Reports section is the dedicated engine for generating historical summaries. Administrators can create custom report templates (e.g., "Monthly Executive Summary") that include specific widgets like "Top Applications by Volume," "Site Availability," or "Circuit Utilization." Crucially, this feature allows for Scheduling, where the system automatically generates the PDF report at a set interval (e.g., first day of the month) and emails it to a distribution list.
Activity Charts (A) / Media Analytics (B): These provide interactive, visual graphs for ad-hoc analysis but are not designed for generating downloadable, scheduled PDF summaries for management.
Flow Browser (D): This is for deep-dive troubleshooting of individual sessions, not for high-level aggregate reporting.