
Practice Free NSE4_FGT_AD-7.6 Exam Online Questions
An administrator manages a FortiGate model that supports NTurbo How does NTurbo acceleration enhance antivirus performance?
- A . For flow-based inspection. NTurbo establishes a dedicated data path to redirect traffic between the IPS engine and FortiGate ingress and egress interfaces.
- B . For flow-based inspection. NTurbo creates two inspection sessions on the FortiGate device.
- C . For proxy-based inspection. NTurbo offloads traffic to the content processor.
- D . For proxy-based inspection. NTurbo buffers the whole file and then sends it to the antivirus engine.
A
Explanation:
According to the FortiOS 7.6 Administration Guide and Fortinet hardware acceleration (NTurbo) documentation, the correct answer is A.
What NTurbo Is (FortiOS 7.6 C Verified)
NTurbo is a hardware-based acceleration feature available on specific FortiGate models. It is designed to improve antivirus and IPS performance when operating in flow-based inspection mode.
NTurbo works by creating a fast, optimized data path between:
FortiGate ingress interface
IPS/AV engine
FortiGate egress interface
This minimizes CPU involvement and reduces packet traversal overhead.
Why Option A Is Correct
Refer to the exhibit.
Which two ways can you view the log messages shown in the exhibit? (Choose two.)
- A . By right clicking the implicit deny policy
- B . Using the FortiGate CLI command diagnose log test
- C . By filtering by policy universally unique identifier (UUID) and application name in the log entry
- D . In the Forward Traffic section
C,D
Explanation:
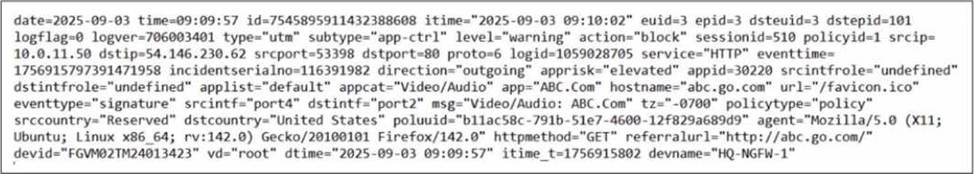
The exhibit shows a FortiGate UTM application control log with fields such as:
type="utm"
subtype="app-ctrl"
action="block"
policyid=1
appid=30220
appcat="Video/Audio"
service="HTTP"
apprisk="elevated"
This is a forward traffic security log, generated by Application Control applied to a firewall policy.
Why the correct answers are C and D
C. By filtering by policy universally unique identifier (UUID) and application name in the log entry Correct.
FortiOS logs can be viewed and filtered in:
Log & Report → Forward Traffic
Administrators can filter logs using fields such as:
Policy ID / Policy UUID
Application name (app)
Application ID (appid)
The log entry clearly includes application-related fields, making filtering by policy and application a valid and documented way to view these logs.
D. In the Forward Traffic section
Correct.
The log is a UTM Application Control log for traffic passing through a firewall policy.
Such logs are displayed under:
Log & Report → Forward Traffic
This is the standard and correct location to view application control, web filter, IPS, and other security profile logs related to user traffic.
Why the other options are incorrect
Refer to the exhibit.
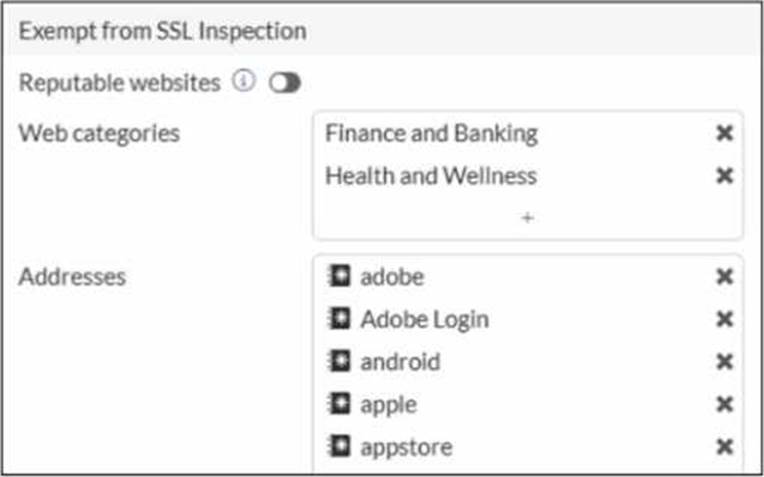
The predefined deep-inspection and custom-deep-inspection profiles exclude some web categories from SSL inspection, as shown in the exhibit.
For which two reasons are these web categories exempted? (Choose two.)
- A . The resources utilization is optimized because these websites are in the trusted domain list on FortiGate.
- B . The legal regulation aims to prioritize user privacy and protect sensitive information for these websites.
- C . These websites are in an allowlist of reputable domain names maintained by FortiGuard.
- D . The FortiGate temporary certificate denies the browser’s access to websites that use HTTP Strict Transport Security.
B,C
Explanation:
In FortiOS 7.6, the predefined deep-inspection and custom-deep-inspection SSL inspection profiles intentionally exclude certain web categories (such as Finance and Banking and Health and Wellness) and well-known domains (for example, Apple, Google, Adobe). This behavior is documented and intentional.
The two correct reasons are:
B. The legal regulation aims to prioritize user privacy and protect sensitive information for these websites.
Correct
Categories like Finance and Banking and Health and Wellness commonly handle highly sensitive personal data.
Many privacy and compliance regulations (for example, GDPR, PCI-DSS, HIPAA-like requirements) discourage or restrict SSL interception for such traffic.
To reduce legal and compliance risks, FortiOS exempts these categories from deep SSL inspection by default.
This is explicitly stated in FortiOS SSL/SSH Inspection documentation.
C. These websites are in an allowlist of reputable domain names maintained by FortiGuard. Correct
FortiGuard maintains a reputable/trusted domain list for well-known services and platforms.
These domains are excluded from deep inspection by default to:
Prevent application breakage
Avoid certificate pinning and compatibility issues
Maintain user experience
This is why domains such as Apple, Google, Adobe, and app stores appear under SSL inspection exemptions.
Why the other options are incorrect
0.11.254/24.
If the host 100.65.1.111 sends a TCP SYN packet on port 443 to 100.65.0.200.
What will the source address, destination address, and destination port of the packet be at the time FortiGate forwards the packet to the destination?
- A . 10.0.11.254, 100.65.0.200. and 443, respectively
- B . 10.0.11.254, 10.0.15.50, and 4443. respectively
- C . 100.65.1. ill, 10.0.11.50, and 4443. respectively
- D . 100.65.1.111, 10.0.11.50. and 443. respectively
C
Explanation:
From the exhibits:
A VIP named VIP-WEB-SERVER is configured on WAN (port2) with: External IP: 100.65.0.200
Mapped (internal) IP: 10.0.11.50 Port forwarding enabled (TCP) External service port: 443 Map to IPv4 port: 4443
The inbound firewall policy Web_Server_Access is: From WAN (port2) to LAN (port4)
Destination: VIP-WEB-SERVER
Service: HTTPS
NAT: Disabled (meaning no source NAT is applied)
What happens to the packet
A host 100.65.1.111 sends TCP SYN dst-port 443 to 100.65.0.200.
When FortiGate matches the VIP and forwards traffic to the internal server, FortiGate performs destination NAT (DNAT) based on the VIP:
Source IP is unchanged because policy NAT is disabled:
Source remains 100.65.1.111
Destination IP is translated by the VIP:
Destination becomes 10.0.11.50
Destination port is translated by the VIP port-forward:
Destination port becomes 4443
Therefore, at the time FortiGate forwards the packet to the destination (internal server), it will be:
Source address: 100.65.1.111
Destination address: 10.0.11.50
Destination port: 4443
Refer to the exhibit.
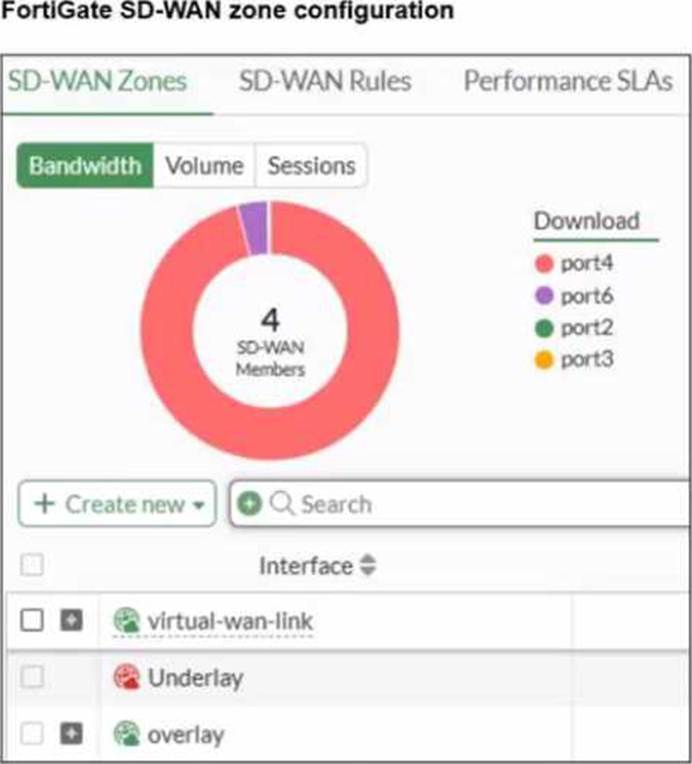
An SD-WAN zone configuration on the FortiGate GUI is shown. Based on the exhibit, which statement is true?
- A . The Underlay zone contains no member.
- B . The virtual-wan-link and overlay zones can be deleted
- C . The Underlay zone is the zone by default.
- D . port2 and port3 are not assigned to a zone.
A
Explanation:
According to the FortiOS 7.6 Administrator Guide and the specific behavior of the SD-WAN GUI, here is the technical breakdown:
SD-WAN Zone Hierarchy and UI Elements: In the FortiGate GUI, SD-WAN zones that contain member interfaces are displayed with a plus (+) icon next to the checkbox. This icon allows administrators to expand the zone and view the specific physical or logical interfaces assigned to it.
Analysis of the "Underlay" Zone: In the provided exhibit, the virtual-wan-link and overlay zones both feature the plus (+) expansion icon, indicating they have active members. The Underlay zone, however, lacks this icon and displays a red status icon. This is the visual indicator in FortiOS that the zone is currently empty and contains no member interfaces.
Mandatory Zone Membership: In FortiOS 7.x, every SD-WAN member interface must be assigned to a zone. It is not possible for an interface to be an "SD-WAN member" (as shown in the legend with port2 and port3) without being assigned to a zone. Since port2 and port3 are listed in the legend, they are indeed assigned to one of the other expanded zones (likely virtual-wan-link or overlay), making Option D incorrect.
Default Zone Behavior: While FortiOS 7.6 often creates default zones like virtual-wan-link, underlay, and overlay during certain configuration wizards or by default in newer versions, they are distinct entities. There is no single "default" zone that acts as a global catch-all in the way Option C suggests.
Immutability of System Zones: While certain system-defined zones have restrictions, the primary focus of this specific exhibit is the current membership state, which clearly shows the Underlay zone is empty.
Refer to the exhibits.
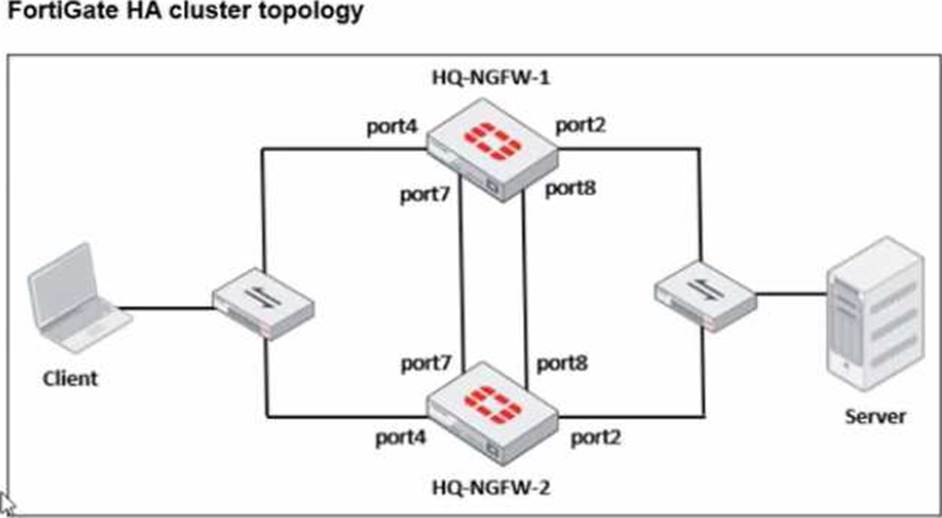
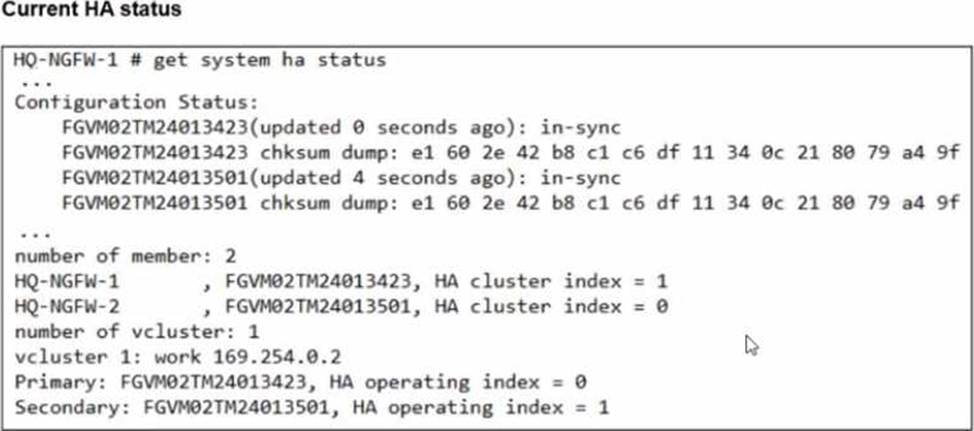
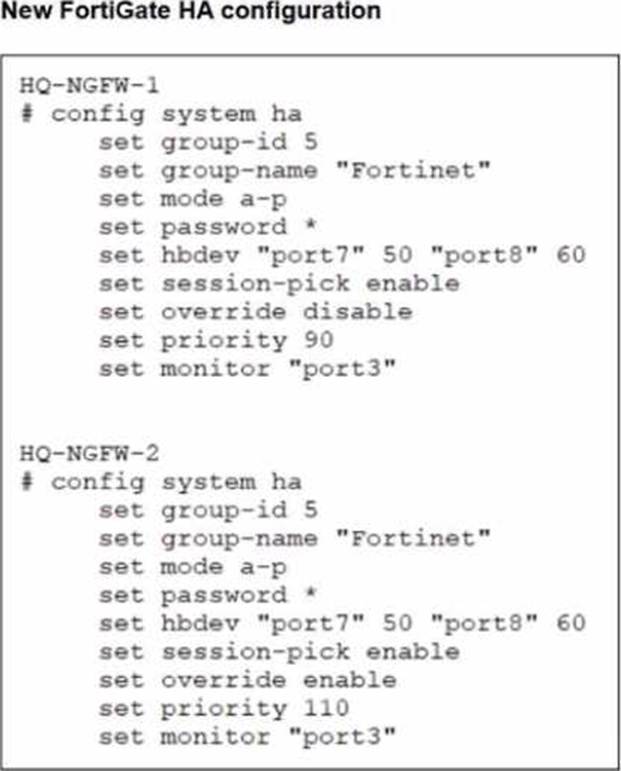
Based on the current HA status, an administrator updates the override and priority parameters on HQ-NGFW-1 and HQ-NGFW-2 as shown in the exhibits.
What would be the expected outcome in the HA cluster?
- A . HQ-NGFW-2 will take over as the primary because it has the override enable setting and higher
priority than HQ-NGFW-1. - B . HQ-NGFW-1 will remain the primary because HQ-NGFW-2 has lower priority
- C . The HA cluster will become out of sync because the override setting must match on all HA members.
- D . HQ-NGFW-1 will synchronize the override disable setting with HQ-NGFW-2.
A
Explanation:
From the current HA status, HQ-NGFW-1 is the primary and HQ-NGFW-2 is the secondary.
The administrator then changes these HA parameters:
HQ-NGFW-1: set override disable, set priority 90
HQ-NGFW-2: set override enable, set priority 110
In FGCP (A-P mode), the override (preemption) feature controls whether a higher-priority unit is allowed to take over the primary role.
When override is enabled, the cluster will prefer (and can re-elect) the unit with the highest device priority to become primary (preempting a lower-priority primary when conditions trigger re-election behavior as defined by FGCP).
Here, HQ-NGFW-2 has:
override enabled
higher priority (110) than HQ-NGFW-1 (90)
Therefore, the expected result is that HQ-NGFW-2 becomes the primary.
Why the other options are incorrect:
B is incorrect because it claims HQ-NGFW-2 has lower priority (it is higher: 110 > 90).
C is incorrect because a mismatch in the override setting is not what causes the “configuration out of sync” condition shown in get system ha status (that is about synchronized configuration databases, not a requirement that override values must match to remain in-sync).
D is incorrect because HA settings like override/priority are not synchronized in the way regular configuration objects are; they are device-level HA parameters.
Refer to the exhibit showing a debug flow output.
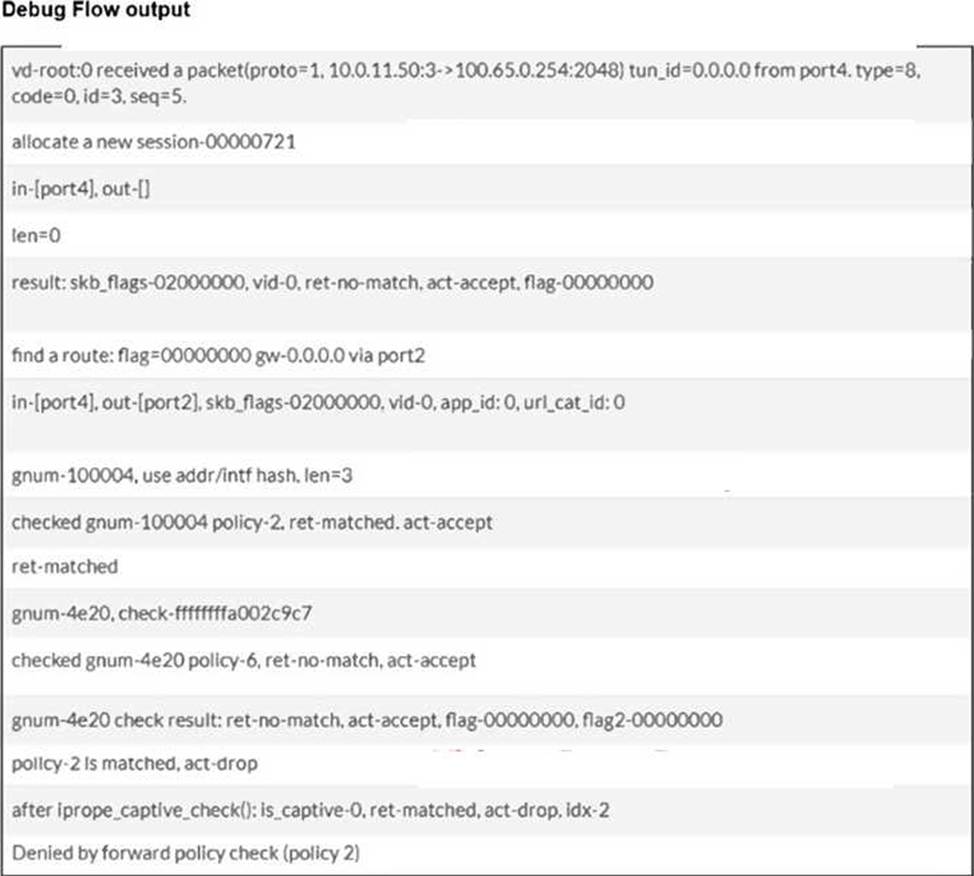
Which two conclusions can you make from the debug flow output? (Choose two answers)
- A . The default gateway is configured on port2.
- B . The RPF check fails.
- C . The debug flow is for UDP traffic.
- D . The matching firewall policy denies the traffic.
A, D
Explanation:
According to the FortiOS 7.6 Troubleshooting and Administration guides, the diagnose debug flow command provides a step-by-step trace of how the FortiGate unit processes a packet.
First, the line "find a route: flag=00000000 gw-0.0.0.0 via port2" indicates that during the routing table lookup, the FortiGate matched the destination against its default route (represented by 0.0.0.0) and determined that the egress interface is port2. This confirms that the default gateway for this traffic is reachable via port2 (Statement A).
Second, the debug trace concludes with the messages "policy-2 Is matched, act-drop" and "Denied by forward policy check (policy 2)". This explicitly indicates that the packet successfully matched the criteria for firewall policy ID 2, and the action configured for that policy is set to Deny (Statement D).
Statement B is incorrect because a Reverse Path Forwarding (RPF) failure would be indicated by a specific "reverse path check fail, drop" message, which is absent here. Statement C is incorrect because the output shows "proto=1", which corresponds to ICMP (Ping) traffic. UDP traffic would be identified as protocol 17.
Refer to the exhibit.
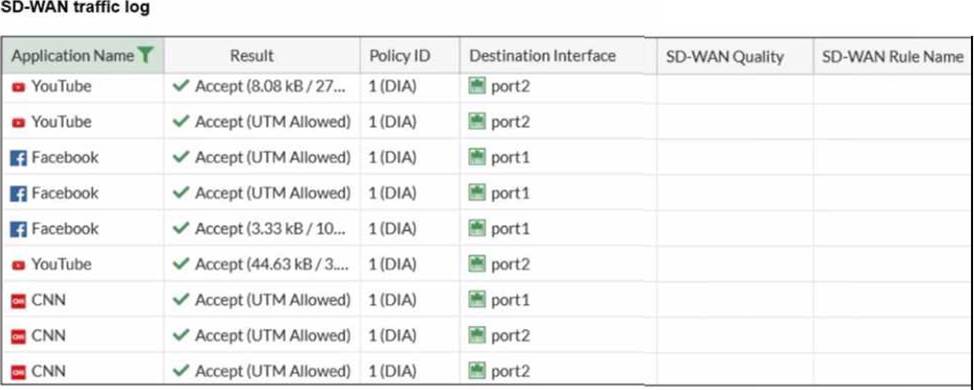
The administrator configured SD-WAN rules and set the FortiGate traffic log page to display SD-WAN-specific columns: SD-WAN Quality and SD-WAN Rule Name
FortiGate allows the traffic according to policy ID 1 placed at the top. This is the policy that allows SD-WAN traffic. Despite these settings, the traffic logs do not show the name of the SD-WAN rule used to steer those traffic flows
What could be the reason?
- A . SD-WAN rule names do not appear immediately. The administrator must refresh the page.
- B . There is no application control profile applied to the firewall policy.
- C . Destinations in the SD-WAN rules are configured for each application, but feature visibility is not
enabled. - D . FortiGate load balanced the traffic according to the implicit SD-WAN rule.
D
Explanation:
In FortiOS 7.6, SD-WAN steering decisions are recorded in traffic logs only when traffic matches an explicit SD-WAN rule (SD-WAN service rule). When no configured SD-WAN rule matches a session, FortiGate uses the implicit (default) SD-WAN rule/behavior to select a member (often resulting in load-balancing or default selection based on the configured SD-WAN algorithm).
In the exhibit, traffic is permitted by firewall policy ID 1, and the Destination Interface alternates between port1 and port2, but SD-WAN Rule Name remains empty. This is consistent with the sessions being forwarded by the implicit SD-WAN rule, which does not populate a named rule in the log columns.
Why the other options are not correct:
A: SD-WAN rule name logging is not a “delayed display” behavior requiring refresh; it is populated per-session when an explicit rule matches.
B: Application Control is not required for SD-WAN rule name to appear. Rule name logging depends on SD-WAN rule match, not on whether Application Control is enabled.
C: Feature visibility affects GUI display options, but the exhibit already shows the SD-WAN columns enabled; the issue is that no explicit SD-WAN rule is being hit.
Refer to the exhibit.
The administrator configured SD-WAN rules and set the FortiGate traffic log page to display SD-WAN-specific columns: SD-WAN Quality and SD-WAN Rule Name
FortiGate allows the traffic according to policy ID 1 placed at the top. This is the policy that allows SD-WAN traffic. Despite these settings, the traffic logs do not show the name of the SD-WAN rule used to steer those traffic flows
What could be the reason?
- A . SD-WAN rule names do not appear immediately. The administrator must refresh the page.
- B . There is no application control profile applied to the firewall policy.
- C . Destinations in the SD-WAN rules are configured for each application, but feature visibility is not
enabled. - D . FortiGate load balanced the traffic according to the implicit SD-WAN rule.
D
Explanation:
In FortiOS 7.6, SD-WAN steering decisions are recorded in traffic logs only when traffic matches an explicit SD-WAN rule (SD-WAN service rule). When no configured SD-WAN rule matches a session, FortiGate uses the implicit (default) SD-WAN rule/behavior to select a member (often resulting in load-balancing or default selection based on the configured SD-WAN algorithm).
In the exhibit, traffic is permitted by firewall policy ID 1, and the Destination Interface alternates between port1 and port2, but SD-WAN Rule Name remains empty. This is consistent with the sessions being forwarded by the implicit SD-WAN rule, which does not populate a named rule in the log columns.
Why the other options are not correct:
A: SD-WAN rule name logging is not a “delayed display” behavior requiring refresh; it is populated per-session when an explicit rule matches.
B: Application Control is not required for SD-WAN rule name to appear. Rule name logging depends on SD-WAN rule match, not on whether Application Control is enabled.
C: Feature visibility affects GUI display options, but the exhibit already shows the SD-WAN columns enabled; the issue is that no explicit SD-WAN rule is being hit.
An administrator wants to configure dead peer detection (DPD) on IPsec VPN for detecting dead tunnels. The requirement is that FortiGate sends DPD probes only when there is no inbound traffic.
Which DPD mode on FortiGate meets this requirement?
- A . On Demand
- B . Enabled
- C . On Idle
- D . Usabled
A
Explanation:
Based on the FortiOS 7.6 Infrastructure and IPsec VPN documentation, Dead Peer Detection (DPD) can be configured in three primary modes: On Demand, On Idle, and Disabled.
On Demand (Default Mode): This mode is specifically designed to minimize unnecessary traffic. In this mode, FortiGate sends DPD probes only when there is no inbound traffic but the FortiGate is attempting to send outbound traffic. Because network communication is typically bidirectional, the absence of inbound traffic while outbound traffic is being sent is a primary indicator of a potentially dead tunnel. This matches the specific requirement described in the question.
On Idle: In this mode, DPD probes are sent if no traffic (neither inbound nor outbound) has been observed in the tunnel for a specific period. It verifies the tunnel status even when the connection is completely idle.
Enabled: In older versions or specific CLI contexts, "Enabled" may refer to periodic DPD, but in the current FortiOS 7.x/7.6 GUI and CLI terminology for Phase 1 settings, the active modes are defined as on-demand or on-idle.
Disabled: In this mode, the FortiGate does not send DPD probes but will still respond to DPD probes sent by the remote peer.
The requirement that the administrator wants probes sent only when there is no inbound traffic (usually implying the FortiGate is sending but not receiving) is the fundamental definition of the On Demand mechanism in the Fortinet curriculum.