
Practice Free PL-300 Exam Online Questions
You have a CSV file that contains user complaints. The file contains a column named Logged. Logged contains the date and time each compliant occurred. The data in Logged is in the fol-lowing format: 2018-12-31 at 08:59. You need to be able to analyze the complaints by the logged date and use a built-in date hierarchy.
What should you do?
- A . Create a column by example that starts with 2018-12-31.
- B . Apply a transformation to extract the last 11 characters of the Logged column and set the data type of the new column to Date.
- C . Apply a transformation to extract the first 11 characters of the Logged column.
- D . split the Logged column by using at as the delimiter.
C
Explanation:
According to Microsoft Certified: Power BI Data Analyst Associate1, Power Query Editor is a tool that lets you connect to one or many data sources, shape and transform the data to meet your needs, then load that model into Power BI Desktop2.
One of the transformations you can perform in Power Query Editor is extract date from text, which creates a date value from a textual representation3. For example, given a text column like this:
Logged
2018-12-31 at 08:59
2019-01-01 at 09:15
You can extract the date part by using the Date.FromText function with a specific format4. The result will be:
You have a PBIX file that contains sensitive Information.
You need to secure the information to meet the following requirements:
• Only internal users must be able to open the file If the file Is shared via email.
• Once the file Is published, only Internal users must be able to open the semantic model and the report downloaded from the Power B1 service.
What should you do?
- A . Use a live function lot the file.
- B . From the Power B1 service, apply a sensitivity label.
- C . Certify the semantic model and the report.
- D . From Microsoft Power B1 Desktop, apply a sensitivity label.
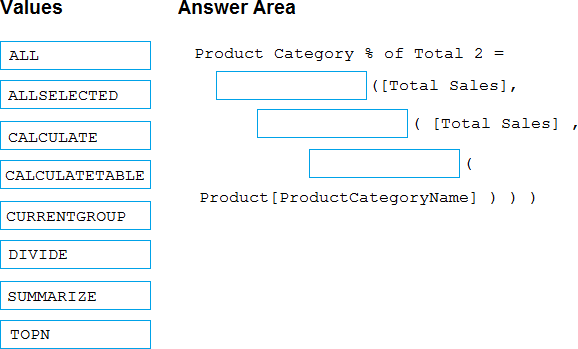
DRAG DROP
You have a Microsoft Power BI data model that contains three tables named Sales, Product, and Date.
The Sales table has an existing measure named [Total Sales] that sums the total sales from the Sales table.
You need to write a calculation that returns the percentage of total sales that a selected ProductCategoryName value represents. The calculation must respect any slicers on ProductCategoryName and must show the percentage of visible total sales. For example, if there are four ProductCategoryName values, and a user filters one out, a table showing ProductCategoryName and the calculation must sum up to 100 percent.
How should you complete the calculation? To answer, drag the appropriate values to the correct targets. Each value may be used once, more than once, or not at all. You may need to drag the split bar between panes or scroll to view content. NOTE: Each correct selection is worth one point.
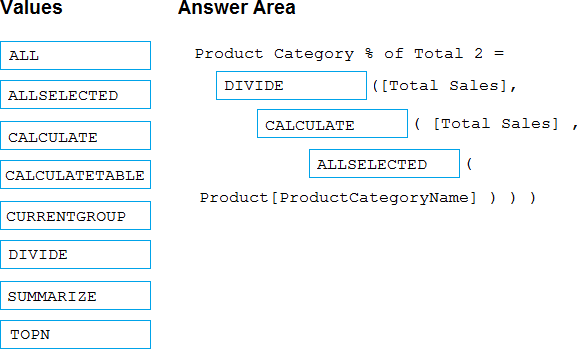
Explanation:
Divide, Calculate, AllSelected.
Reference: https://docs.microsoft.com/en-us/dax/allselected-function-dax
You have a Power Bl report for the marketing department.
The report reports on web traffic to a blog and contains data from the following tables.
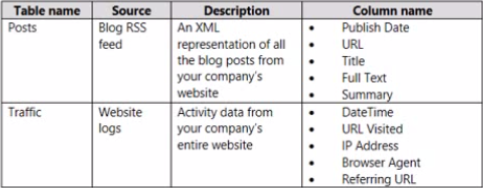
There is a one-to-many relationship from Posts to Traffic that uses the URL and URL Visited columns.
The report contains the visuals shown in the following table.
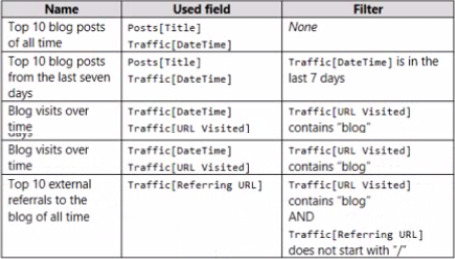
The dataset takes a long time to refresh.
You need to modify Posts and Traffic queries to reduce toad times.
Which two actions will reduce the toad times? Each correct answer presents part of the solution. NOTE: Each correct selection is worth one point.
- A . Remove the rows in Traffic in which Traffic [Referring URL] does not start with "/"
- B . Remove the rows in Posts in which Post [Publish Date] is in the last seven days.
- C . Remove Traffic [IP Address], Traffic (Browser Agent], and Traffic [Referring URL).
- D . Remove Posts [Full Text] and Posts [Summary].
- E . Remove the rows in Traffic in which Traffic [URL visited] does not contain "blog”
HOTSPOT
You have a Power B1 semantic model.
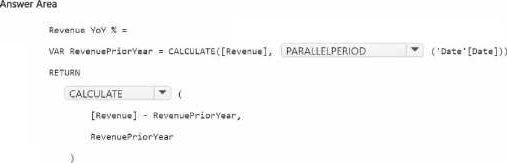
You need to create a column that will contain year over year (YOY) revenue. The column must contain a ratio of change factor compared to the previous year’s monthly revenue.
How should you complete the OAX formula? To answer, select the appropriate options in the answer area. NOTE: Each correct selection is worth one point.

Note: This question is part of a series of questions that present the same scenario. Each question in the series contains a unique solution that might meet the stated goals. Some question sets might have more than one correct solution, while others might not have a correct solution.
After you answer a question in this section, you will NOT be able to return to it. As a result, these questions will not appear in the review screen.
You have a Power BI report that imports a date table and a sales table from an Azure SQL database data source.
The sales table has the following date foreign keys:
✑ Due Date
✑ Order Date
✑ Delivery Date
You need to support the analysis of sales over time based on all the date foreign keys.
Solution: From Power Query Editor, you rename the date query as Due Date. You reference the Due Date query twice to make the queries for Order Date and Delivery Date.
Does this meet the goal?
- A . Yes
- B . No
A
Explanation:
Creating two additional tables in Power Query can be a possible solution:
Remove any inactive relationships.
Consider renaming the role-playing dimension-type table to better describe its role. In the example, the Airport table is related to the ArrivalAirport column of the Flight table, so it’s renamed as Arrival Airport.
Create a copy of the role-playing table, providing it with a name that reflects its role. If it’s an Import table, we recommend defining a calculated table. If it’s a DirectQuery table, you can duplicate the Power Query query.
In the example, the Departure Airport table was created by using the following calculated table definition.
HOTSPOT
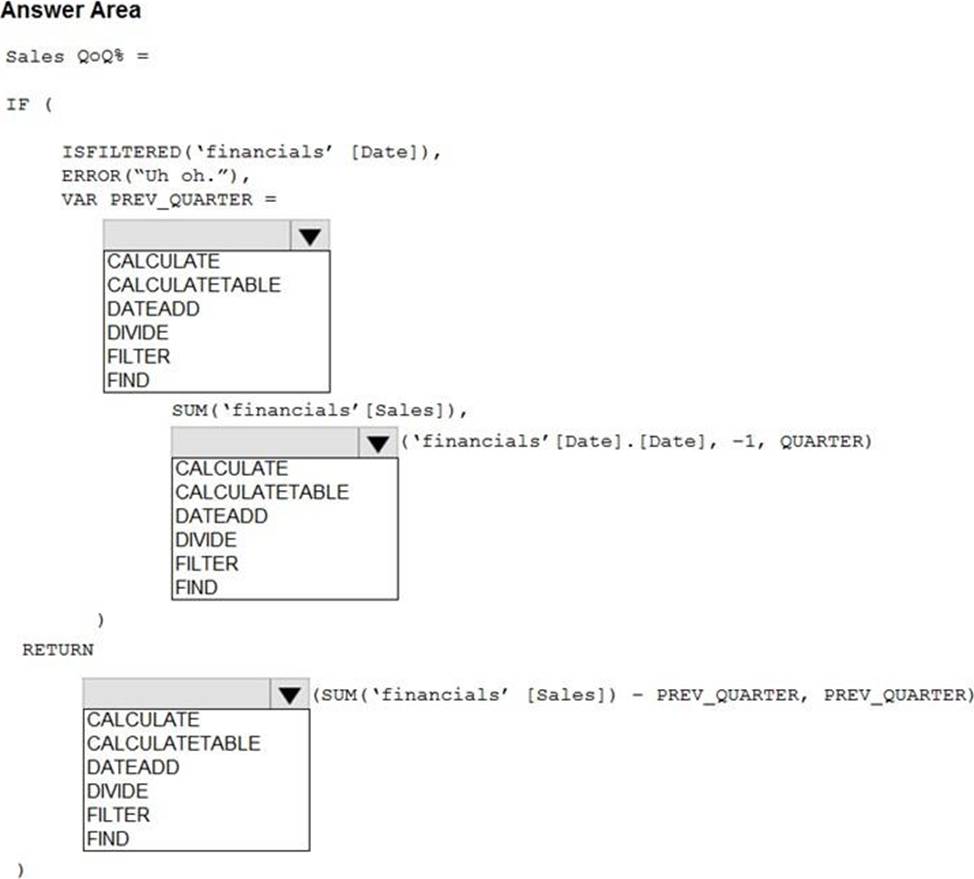
You are building a financial report by using Power BI.
You have a table named financials that contains a column named Date and a column named Sales.
You need to create a measure that calculates the relative change in sales as compared to the previous quarter.
How should you complete the measure? To answer, select the appropriate options in the answer area. NOTE: Each correct selection is worth one point.
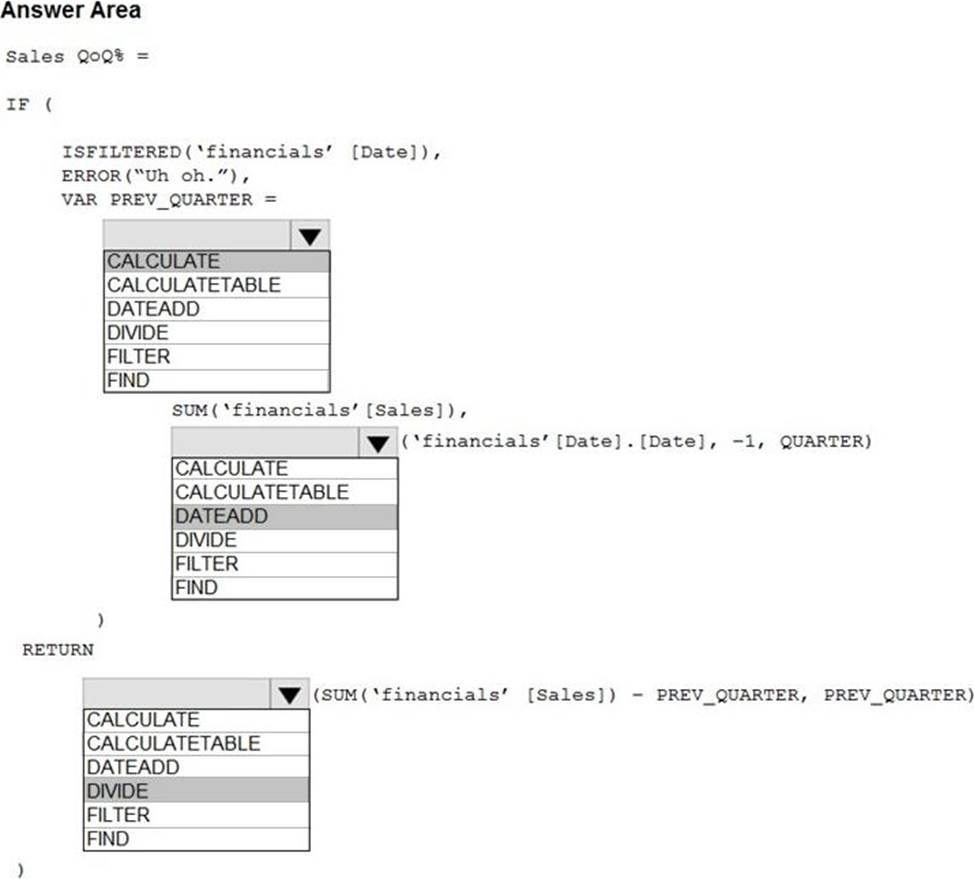
Explanation:
Box 1: CALCULATE
Box 2: DATEADD
Box 3: DIVIDE
Example:
NET_SALES QoQ% =
IF(
ISFILTERED(‘Calendar'[Date]),
ERROR("Time intelligence quick measures can only be grouped or filtered by the Power BI-provided date hierarchy or primary date column."),
VAR __PREV_QUARTER =
CALCULATE(
SUM(‘research ra_qtr_template'[NET_SALES]),
DATEADD(‘Calendar'[Date].[Date], -1, QUARTER)
)
RETURN
DIVIDE(
SUM(‘research ra_qtr_template'[NET_SALES]) – __PREV_QUARTER,
__PREV_QUARTER
)
)
Reference: https://community.powerbi.com/t5/Desktop/Error-calculating-QOQ-using-quick-measure/m-p/547054
You have an on-premises Power BI Report Server.
You plan to create a report in Power BI Desktop and publish the report to the report server.
Which data source should the report use?
- A . Microsoft Azure SQL Database
- B . a Microsoft SQL Server database
- C . a Microsoft SQL Server Analysis Services (SSAS) database
- D . Microsoft Excel
C
Explanation:
Reference:
https://docs.microsoft.com/en-us/power-bi/report-server/quickstart-create-powerbi-report
https://docs.microsoft.com/en-us/power-bi/report-server/connect-data-sources
You have a Power Bl report that contains the table shown in the following exhibit.
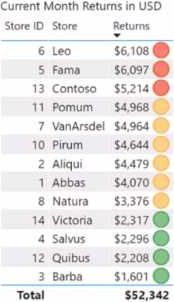
The table contains conditional formatting that shows which stores are above, near, or below the monthly quota for returns. You need to ensure that the table is accessible to consumers of reports who have color vision deficiency.
What should you do?
- A . Add alt text that lists the values in the table.
- B . Change the icons to use a different shape for each color.
- C . Remove the icons and use red, yellow, and green background colors instead
- D . Move the conditional formatting icons to a tooltip report
You have a Power Bl model that contains the following data.
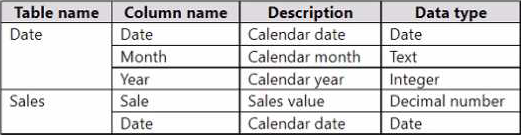
The Date table relates to the Sales table by using the Date columns.
The model contains the following DAX measure.
Total Sales = SUM(Sales[Sale])
You need to create another measure named Previous Quarter to display the sales one quarter before the selected period.
Which DAX calculation should you use?
- A . CALCULATE < [Total Sales], OATEADD (Date[Date], -1, QUARTER))
- B . CALCULATE ([Total Sales], DATESQTD (Date[Date]))
- C . TOTALQTD ([Total Sales], Date[Date])
- D . CALCULATE < [Total Sales], PARALLELPERIOO (Date[Date], 1, QUARTER))