Practice Free PL-300 Exam Online Questions
HOTSPOT
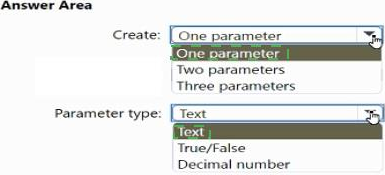
You need to create a visual as shown in the following exhibit.
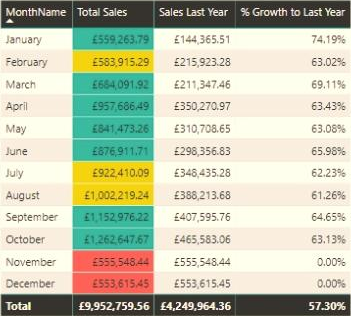
The indicator color for Total Sales will be based on % Growth to Last Year.
The solution must use the existing calculations only.
How should you configure the visual? To answer, select the appropriate options in the answer area. NOTE: Each correct selection is worth one point.
Explanation:
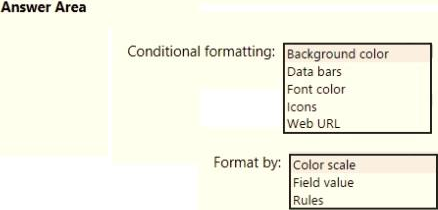
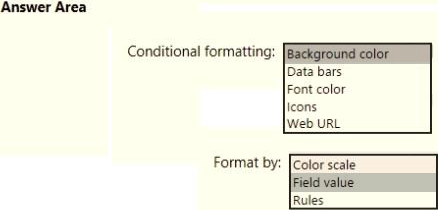
Box 1: Background color
To format the Color column based on its field values, select Conditional formatting for the Color field, and then select Background color or Font color.
In the Background color or Font color dialog box, select Field value from the Format by drop-down field.
Box 2: Field value
With conditional formatting for tables in Power BI Desktop, you can specify customized cell colors, including color gradients, based on field values.
Reference: https://docs.microsoft.com/en-us/power-bi/create-reports/desktop-conditional-table-formatting
You are creating a line chart in a Power Bl report as shown in the following exhibit.

Use the drop-down menus to select the answer choice that completes each statement based on the information presented in the graphic. NOTE: Each correct selection is worth one point.


You have the tables shown in the following table.

The Impressions table contains approximately 30 million records per month.
You need to create an ad analytics system to meet the following requirements:
Present ad impression counts for the day, campaign, and Site_name. The analytics for the last year are required.
Minimize the data model size.
Which two actions should you perform? Each correct answer presents part of the solution. NOTE: Each correct selection is worth one point.
- A . Group the impressions by Ad_id, Site_name, and Impression_date. Aggregate by using the CountRows function.
- B . Create one-to-many relationships between the tables.
- C . Create a calculated measure that aggregates by using the COUNTROWS function.
- D . Create a calculated table that contains Ad_id, Site_name, and Impression_date.
B, C
Explanation:
Grouping in power query reduces the number of rows in the impression table that is gonna be loaded in the model. Creating relationships doesn’t increase the size of the model.
You have the Power Bi dashboard shown in the Dashboard exhibit (Click the Dashboard tab.)
You need to ensure that when users view the dashboard on a mobile device, the dashboard appears as shown in the Mobile exhibit. (Click the Mobile tab.)
What should you do? To answer, select the appropriate options m the answer area NOTE: Each correct selection is worth one point.


In Power Bi Desktop, you are creating visualizations in a report based on an imported dataset
You need to allow Power Bi users to export the summarized data used to create the visualizations but prevent the users from exporting the underlying data
What should you do?
- A . From Power BI Desktop, configure the Data Load settings for the current file.
- B . From the Power BI service, configure the dataset permissions.
- C . From Power BI Desktop, configure the Report settings for the current file.
- D . From Power BI Desktop, modify the data source permissions.
C
Explanation:
https://learn.microsoft.com/en-us/power-bi/visuals/power-bi-visualization-export-data?tabs=powerbi-desktop
The export functionality can be disabled on several levels. First, Power BI Service admins can disable this functionality on tenant level. With that, nobody will be able to export the data. More about that later. Second, as a dataset owner you can decide if you allow your users to export the data. This is managed in dataset settings, but only changeable in Power BI desktop.
No matter what settings are applied in Power BI desktop, the tenant settings will overrule this. In the end the Power BI Service admin decides what options are possible to use.
https://data-marc.com/2020/04/13/power-bi-governance-why-you-should-consider-to-disable-export-to-excel/
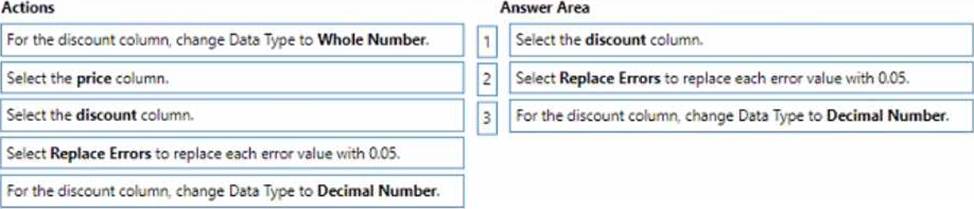
DRAG DROP
You use Power Query Editor to preview the data shown in the following exhibit

You need to clean and transform the query so that all the rows of data are maintained, and error values in the discount column are replaced with a discount of 0.05. The solution must minimize administrative effort.
Which three actions should you perform in sequence? To answer move the appropriate actions from the list of actions to the answer area and arrange them in the correct order.

You are creating a Power Bl report by using Power Bi Desktop.
You need to include a visual that shows trends and other useful information automatically. The visual must update based on selections in other visuals.
Which type of visual should you use?
- A . key influencers
- B . decomposition tree
- C . Q&A
- D . smart narrative
DRAG DROP
You have a Power Bl table named Customer that contains a field named Email Address.
You discover that multiple records contain the same email address.
You need to create a calculated column to identify which records have duplicate email addresses.
How should you complete the OAX expression for the calculated column? To answer, drag the appropriate values to the correct targets. Each value may be used once, more than once, or not at all. You may need to drag the split bar between panes or scroll to view content. NOTE: Each correct selection is worth one point.
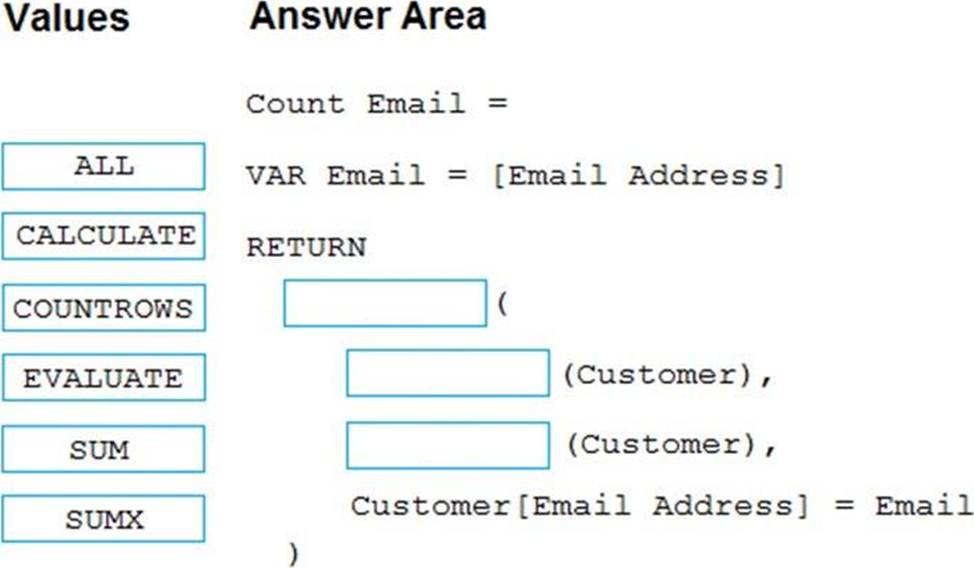
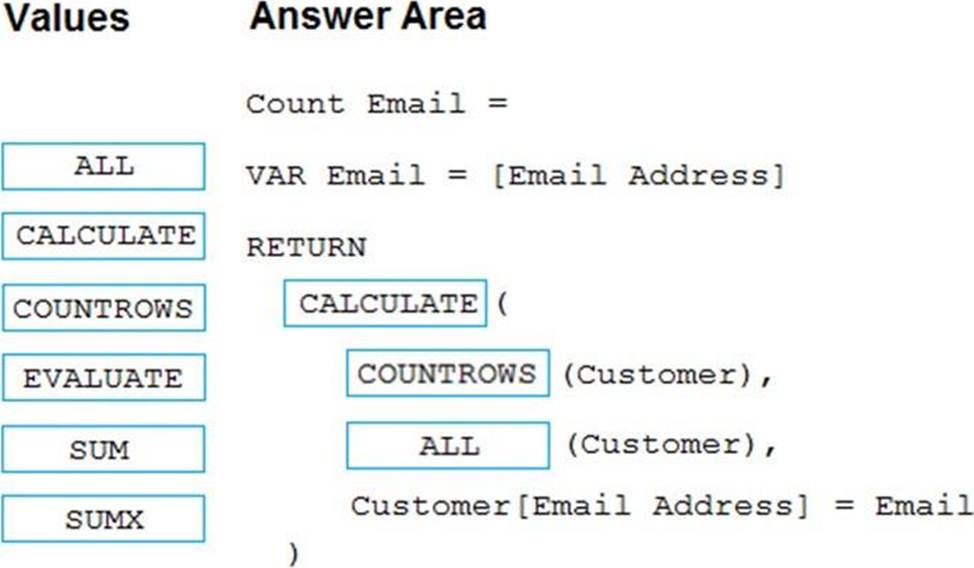
Explanation:
You are to count the number of rows having same email address.
HOTSPOT
You have the Azure SQL databases shown in the following table.
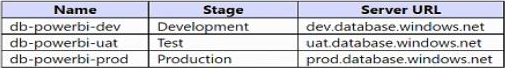
You plan to build a single PBIX file to meet the following requirements:
• Data must be consumed from the database that corresponds to each stage of the development lifecycle.
• Power Bl deployment pipelines must NOT be used.
• The solution must minimize administrative effort.
What should you do? To answer, select the appropriate options in the answer area.