Practice Free PL-300 Exam Online Questions
HOTSPOT
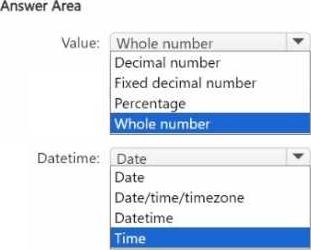
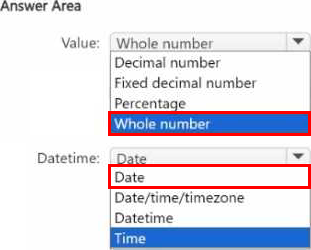
You use Power Query Editor to ingest data into Power Bl Desktop.
The total dataset contains 250,000 rows.
All the rows match the format of the data as shown in the following exhibit.
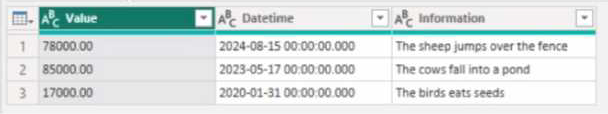
You need to optimize the data model size of the table.
Which type of data should you use for the Value column and the Datetime column? To answer, select the appropriate options in the answer area. NOTE: Each correct selection is worth one point.
You import two Microsoft Excel tables named Customer and Address into Power Query Customer contains the following columns:
• Customer ID
• Customer Name
• Phone
• Email Address
• Address ID
Address contains the following columns:
• Address ID
• Address Line 1
• Address Line 2
• City
• State/Region
• Country
• Postal Code
Each Customer ID represents a unique customer m the Customer table. Each Address ID represents a unique address m the Address table. You need to create a query that has one row per customer. Each row must contain City. State/Region, and Country for each customer.
What should you do?
- A . Append the Customer and Address tables.
- B . Transpose the Customer and Address tables.
- C . Group the Customer and Address tables by the Address ID column.
- D . Merge the Customer and Address tables.
You have a collection of reports for the HR department of your company.
You need to create a visualization for the HR department that shows a historic employee counts and predicts trends during the next six months.
Which type of visualization should you use?
- A . scatter chart
- B . ribbon chart
- C . line chart
- D . key influences
C
Explanation:
The best data for forecasting is time series data or uniformly increasing whole numbers. The line chart has to have only one line.
Try forecasting: Try the new forecasting capabilities of Power View today on your own data or with
the sample report available as part of the Power BI report samples. To view your own data, upload a workbook with a Power View time series line chart to Power BI for Office 365.
Reference: https://powerbi.microsoft.com/en-us/blog/introducing-new-forecasting-capabilities-in-power-view-for-office-365
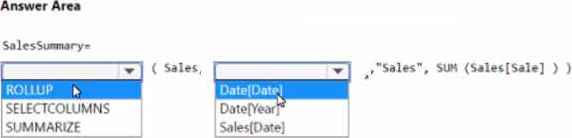
HOTSPOT
You have a Power BI model that contains the following data.
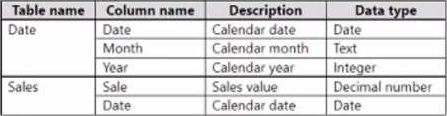
The Date table relates to the Sales table by using the Date columns.
You need to create a calculated table that v/ill contain the following:
You have a Microsoft Power Bl report. The size of PBIX file is 550 MB. The report is accessed by using an App workspace in shared capacity of powerbi.com.
The report uses an imported dataset that contains one fact table. The fact table contains 12 million rows. The dataset is scheduled to refresh twice a day at 08:00 and 17:00.
The report is a single page that contains 15 custom visuals and 10 default visuals.
Users say that the report is slow to load the visuals when they access and interact with the report
You need to recommend a solution to improve the performance of the report.
What should you recommend?
- A . Split the visuals onto multiple pages.
- B . Implement row-level security (RLS).
- C . Replace the default visuals with custom visuals.
- D . Increase the number of times that the dataset is refreshed.
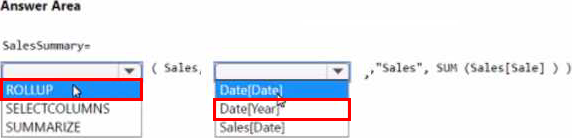
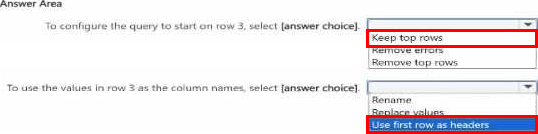
HOTSPOT
You use Power Query Editor to preview the data shown in the following exhibit.

DRAG DROP
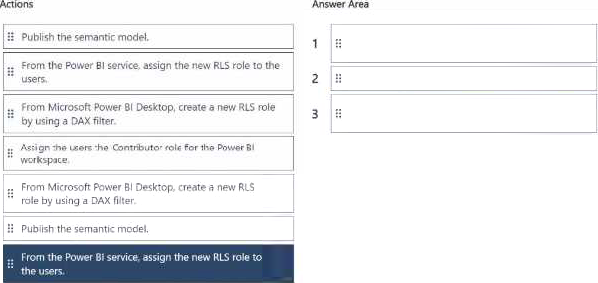
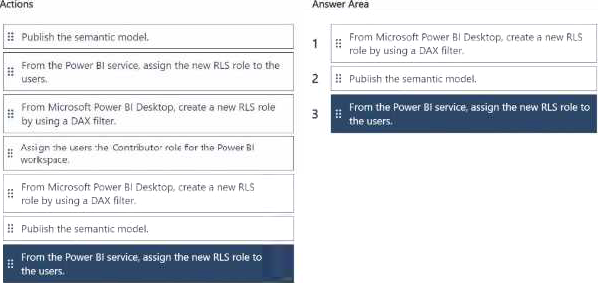
You have a semantic model.
You need to configure row level security (RLS) to restrict data access for users that have the Viewer permissions.
Which three actions should you perform in sequence? To answer, move the appropriate actions from the list of actions to tie answer area and arrange them in the correct order.
HOTSPOT
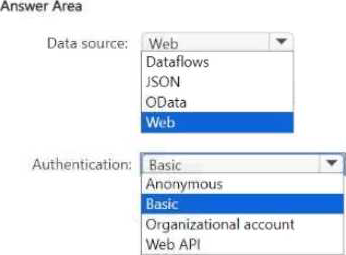
You plan to use Power Query Editor to get data from an API.
The API returns a JSON response.
You have a username and password tor the API.
Which data source and authentication method should you use to connect to the API? To answer, select the appropriate options in the answer area. NOTE: Each correct selection is worth one point.

HOTSPOT
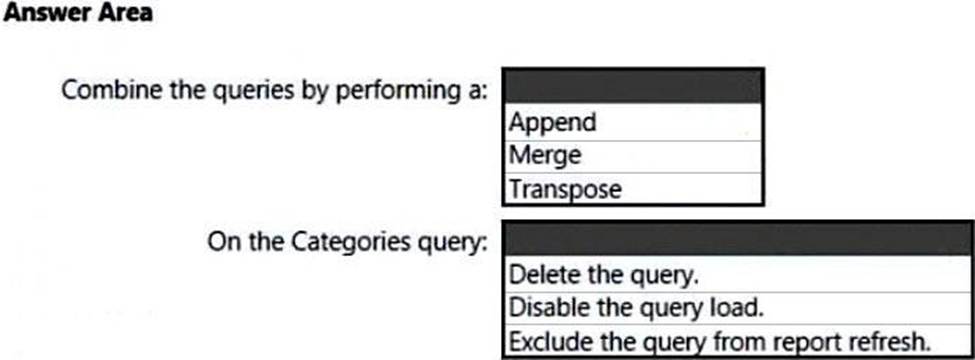
You have two CSV files named Products and Categories.
The Products file contains the following columns:
✑ ProductID
✑ ProductName
✑ SupplierID
✑ CategoryID
The Categories file contains the following columns:
✑ CategoryID
✑ CategoryName
✑ CategoryDescription
From Power BI Desktop, you import the files into Power Query Editor.
You need to create a Power BI dataset that will contain a single table named Product.
The Product will table includes the following columns:
✑ ProductID
✑ ProductName
✑ SupplierID
✑ CategoryID
✑ CategoryName
✑ CategoryDescription
How should you combine the queries, and what should you do on the Categories query? To answer, select the appropriate options in the answer area. NOTE: Each correct selection is worth one point.