
Practice Free PL-300 Exam Online Questions
You have a Power Bl report named Report1 and a dashboard named Dashboard1, Report1 contains a line chart named Sales by month.
You pin the Sales by month visual to Dashboard1.
In Report1, you change the Sales by month visual to a bar chart.
You need to ensure that bar chart displays on Dashboard1.
What should you do?
- A . Edit the details for the dashboard tile of Dashboard1.
- B . Select Refresh visuals for Dashboard1.
- C . the Sales by month bar chart to Dashboard1
- D . Refresh the dataset used by Report1 and Dashboard1.
You need to get data from the Microsoft SQL Server tables.
What should you use to configure the connection’
- A . import that uses a Microsoft account
- B . DirectQuery that uses the end-user s credentials
- C . DirectQuery that uses a database credential
- D . Import that uses a database credential
HOTSPOT
You have a Power BI report that contains the table visual shown in the following exhibit.
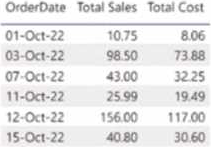

You need to use Power B1 to create a visual that will allow users to compare the sales performance of five sales regions for the current month.
Which visual should you use?
- A . a stacked bar chart
- B . a 100% stacked bar chart
- C . a waterfall chart
- D . a line chart
You have a table that contains sales data and approximately 1,000 rows.
You need to identify outliers in the table.
Which type of visualization should you use?
- A . area chart
- B . donut chart
- C . scatter plot
- D . pie chart
C
Explanation:
Outliers are those data points that lie outside the overall pattern of distribution & the easiest way to detect outliers is though graphs. Box plots, Scatter plots can help detect them easily.
Reference: https://towardsdatascience.com/this-article-is-about-identifying-outliers-through-funnel-plots-using-the-microsoft-power-bi-d7ad16ac9ccc
HOTSPOT
You need to create a visualization to meet the reporting requirements of the sales managers.
How should you create the visualization? To answer, select the appropriate options in the answer area. NOTE: Each correct selection is worth one point.

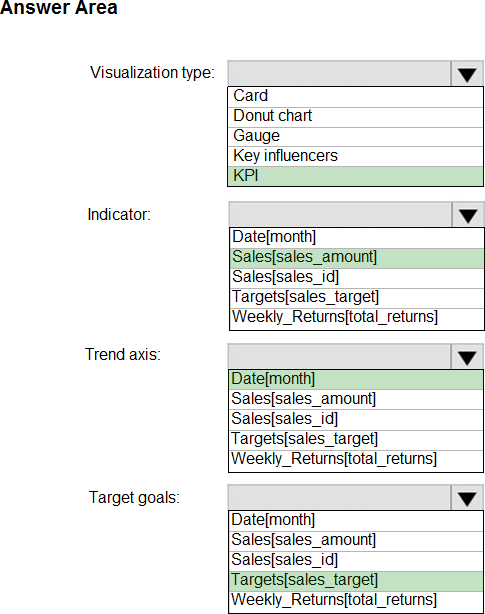
Explanation:
Scenario: The sales managers require a visual to analyze sales performance versus sales targets.
Box 1: KPI
A Key Performance Indicator (KPI) is a visual cue that communicates the amount of progress made toward a measurable goal.
Box 2: Sales[sales_amount]
Box 3: Date[month]
Time > FiscalMonth. This value will represent the trend.
Box 4: Targets[sales_target]
Reference: https://docs.microsoft.com/en-us/power-bi/visuals/power-bi-visualization-kpi
You need to create the required relationship for the executive’s visual.
What should you do before you can create the relationship?
- A . Change the data type of Sales[region_id] to Whole Number.
- B . In the Sales table, add a measure for sum(sales_amount).
- C . Change the data type of sales[sales_id] to Text.
- D . Change the data type of sales [region_id] to Decimal Number.
A
Explanation:
Scenario: Executives require a visual that shows sales by region.
Need to change the sales_id column from Varchar to Whole Number (Integer).
Note: This question is part of a series of questions that use the same scenario. For your convenience, the scenario is repeated in each question. Each question presents a different goal and answer choices, but the text of the scenario is the same in each question in this series.
You have a Microsoft SQL Server database that contains the following tables.
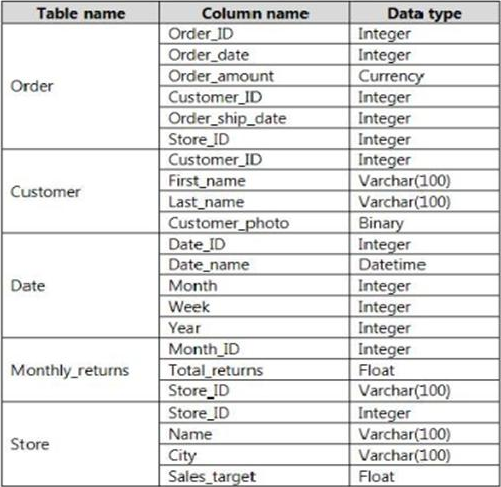
The following columns contain date information:
– Date[Month] in the mmyyyy format
– Date[Date_ID] in the ddmmyyyy format
– Date[Date_name] in the mm/dd/yyyy format
– Monthly_returns[Month_ID] in the mmyyyy format
The Order table contains more than one million rows.
The Store table has a relationship to the Monthly_returns table on the Store_ID column. This is the only relationship between the tables.
You plan to use Power BI Desktop to create an analytics solution for the data.
You need to create a relationship between the Order table and the Store table on the Store_ID column.
What should you do before you create the relationship?
- A . In the Order table query, use the Table.TrasformRows function.
- B . In the Store table query, use the Table.TrasformRows function.
- C . In the Store table query, use the Table.TrasformColumnTypes function.
- D . In the Order table query, use the Table.TrasformColumnTypes function.
You have a semantic model that contains a table named Employees.
The table contains the following columns:
• Employee ID
• First Name
• Last Name
• Department
• Salary
Each employee is uniquely identified by using Employee ID.
You need to create a DAX measure that will calculate the average salary of all the employees in the sales department.
Which DAX expression should you use?
- A . AVERAGE(‘Employees'[Salary])
- B . CALCULATE(AVERAGE(‘Employees'[Salary]), ‘Employees'[Department] = "Sales")
- C . DISTINCTCOUNT(‘Employees'[Salary])
- D . CALCULATE(DISTINCTCOUNT(‘Employees'[Salary]), ‘Employees'[Department] = "Sales")
DRAG DROP
You are preparing a financial report in Power BI.
You connect to the data stored in a Microsoft Excel spreadsheet by using Power Query Editor as shown in the following exhibit.
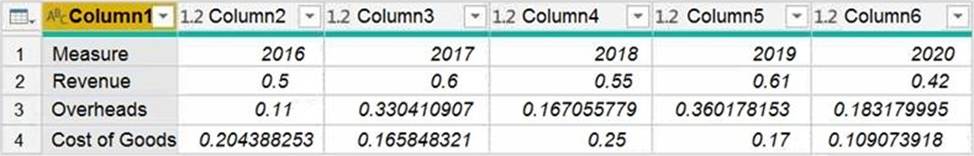
You need to prepare the data to support the following:
✑ Visualizations that include all measures in the data over time
✑ Year-over-year calculations for all the measures
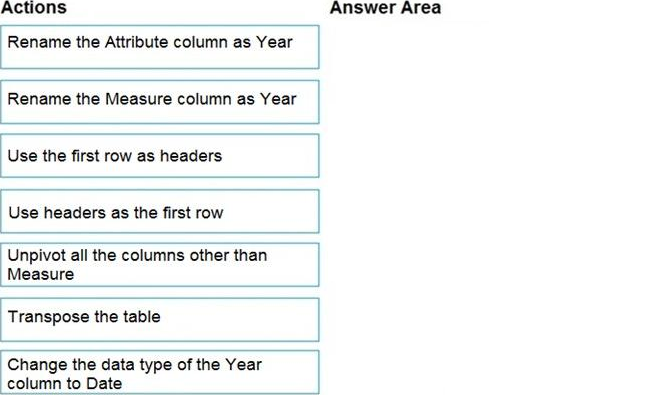
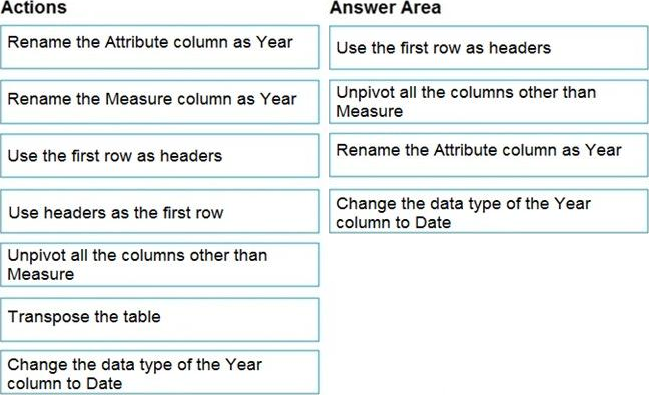
Which four actions should you perform in sequence? To answer, move the appropriate actions from the list of actions to the answer area and arrange them in the correct order.
Explanation: