
Practice Free PL-300 Exam Online Questions
HOTSPOT
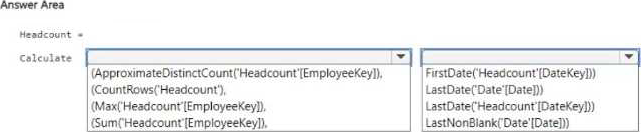
You ate creating a Power 81 report that will show the number of current employees over time. The report will use Import storage mode for all tables.
The employment data will be imported from Azure SQL Database in a monthly snapshot.
The data will be stored in a table named Headcount and will contain the following:
• One row per employee for each month the employee is employed
• In each row, a date key that shows the first day of the month of each snapshot
You have a related date table that contains dates for the years 2020 to 2030.

Adding an index key and normalizing casing in the data source would help resolve issues with undefined values and errors in a case-sensitive column. The index key can provide a unique identifier, and normalizing casing ensures consistency in the data, which would likely prevent the errors you encountered in the Power BI semantic model.
You have a Power BI data model that imports a date table and a sales table from an Azure SQL database data source.
The sales table has the following date foreign keys.
• Due Date
• Order Date
• Delivery Date
You need to support the analysis of sales over time based on all three dates at the same time.
Solution: You create measures that use the USERELATIONSHIP DAX function to filter sales on the inactive relationships between sales table and the date table.
Does this meet the goal?
- A . Yes
- B . No
HOTSPOT
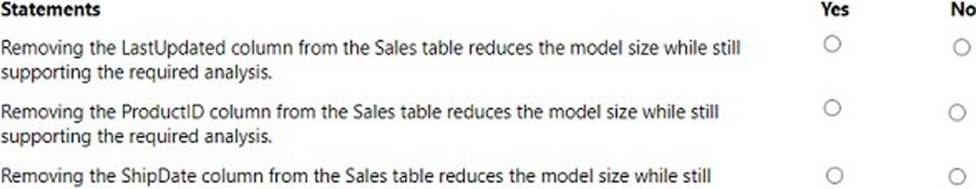
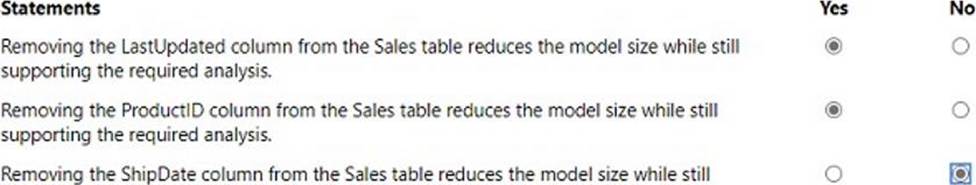
The data model must support the following analysis:
✑ Total sales by product by month in which the order was placed
✑ Quantities sold by product by day on which the order was placed
✑ Number Of sales transactions by quarter in Which the order was placed
For each Of the following statements, select Yes if the statement is true. Otherwise, select NO.
You have a Power Bl report that will be rendered on a vertical display. You need to maximize the portion of the screen area used by the report.
What should you do?
- A . From Power B1 Desktop, select Personalize visuals.
- B . From the Power B1 service, enable the Pages pane.
- C . From the Canvas background setting of Power B1 Desktop, configure the Image fit setting.
- D . From the Canvas settings of Power B1 Desktop, set a custom width and height.
You have a Power Bi model mat contains a table named Date.
The Date table contains the fallowing columns:
• Date
• Fiscal year
• Fiscal Quartet
• Month Name
• Calendar Year
• Week Number
• Month Number
• Calendar Quarter
You need to create a calculated table based on the Date table. The calculated tab*e must contain only unique combinations of values for Calendar Year. Calendar Quarter and Calendar Month.
Which DAX function should you include in the table deflation?
- A . DATATABLE
- B . ADDCOLUMS
- C . SUMMARIZE
- D . CALCULATE
Your company has employees in 10 states.
The company recently decided to associate each state to one of the following three regions: East, West, and North.
You have a data model that contains employee information by state. The model does NOT include region
information.
You have a report that shows the employees by state.
You need to view the employees by region as quickly as possible.
What should you do?
- A . Create a new aggregation that summarizes by employee.
- B . Create a new group on the state column and set the Group type to List.
- C . Create a new group on the state column and set the Group type to Bin.
- D . Create a new aggregation that summarizes by state.
B
Explanation:
https://www.mssqltips.com/sqlservertip/4720/binning-and-grouping-data-with-power-bi/
You have a Power Bl report that uses row-level security (RLS).
You need to transfer RLS membership maintenance to an Azure network security team. The solution must NOT provide the Azure network security team with the ability to manage reports, datasets. or dashboards.
What should you do?
- A . Add the Azure network security team as members of the RLS role.
- B . Instruct the Azure network security team to create security groups. Configure RLS to use the groups.
- C . Configure custom instructions for the Request access feature that instructs users to contact the Azure network security team.
- D . Grant the Read and Build permissions for the Power Bl datasets to the Azure network security team.
B
Explanation:
It is common practice that the PBI developer creates RLS groups and instructs the network team to create the corresponding AD roles. Then the developer assigns the AD groups to the RLS groups.
You have a Microsoft Power Bl dashboard.
You need to ensure that consumers of the dashboard can give you feedback that will be visible to the other consumers of the dashboard.
What should you use?
- A . Feedback
- B . Subscribe
- C . Comments
- D . Mark as favorite
C
Explanation:
https://docs.microsoft.com/en-us/power-bi/consumer/end-user-comment
You have a Power 81 semantic model that contains a table named Table1. Table1 runs in Import storage mode. You need to update the model to change the storage mode of Table1 to DirectQuery.
What should you do?
- A . Delete Table1. and then add the table to the model again in DirectQuery storage mode.
- B . From Power Query Editor, duplicate the query for Table1.
- C . From Model view, change the storage mode of Table1 to DirectQuery
- D . Add an aggregation table to the model.