
Practice Free PL-300 Exam Online Questions
HOTSPOT
You have a Power Bl semantic model that contains the following tables.
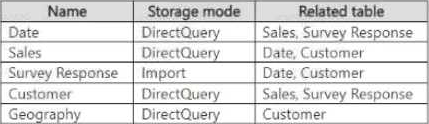
All the tables use the same data source.
You need to reduce the number of limited relationships in the model by changing the storage mode of certain tables. The solution must NOT affect the latency of the data.
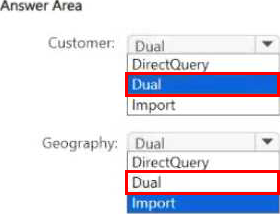
Which storage mode should you select for the Customer and Geography tables? To answer, select the appropriate options in the answer area. NOTE: Each correct selection is worth one point.

You have a semantic model that uses a live connection to a semantic model in the Power BI service.
You need to create a Power BI report named RPT1 that only uses the live connection.
Which three components can you add to RPT1? Each correct answer presents a complete solution.
- A . a report measure
- B . a new column
- C . a calculated table
- D . a calculated column
- E . a new table
You have multiple dashboards.
You need to ensure that when users browse the available dashboards from powerbi.com. they can see which dashboards contain Personally Identifiable Information (Pll). The solution must minimize configuration effort and impact on the dashboard design.
What should you use?
- A . Active Directory groups
- B . tiles
- C . data classifications
- D . comments
You create a dashboard by using the Microsoft Power Bl Service. The dashboard contains a card visual that shows total sales from the current year. You grant users access to the dashboard by using the viewer role on the workspace. A user wants to receive daily notifications of the number shown on the card visual. You need to automate the notifications.
What should you do?
- A . Share the dashboard to the user.
- B . Create a subscription.
- C . Create a data alert.
- D . Tag the user in a comment.
C
Explanation:
You can subscribe yourself and your colleagues to the report pages, dashboards, and paginated reports that matter most to you.
Power BI e-mail subscriptions allow you to:
Decide how often you want to receive the emails: daily, weekly, hourly, monthly, or once a day after the initial data refresh.
Choose the time you want to receive the email, if you choose daily, weekly, hourly, or monthly.
Note: Email subscriptions don’t support most custom visuals. The one exception is those custom visuals that have been certified.
Email subscriptions don’t support R-powered custom visuals at this time.
Incorrect Answers:
A: Set data alerts to notify you when data in your dashboards changes beyond limits you set.
Reference:
https://docs.microsoft.com/en-us/power-bi/collaborate-share/service-report-subscribe
https://docs.microsoft.com/en-us/power-bi/create-reports/service-set-data-alerts
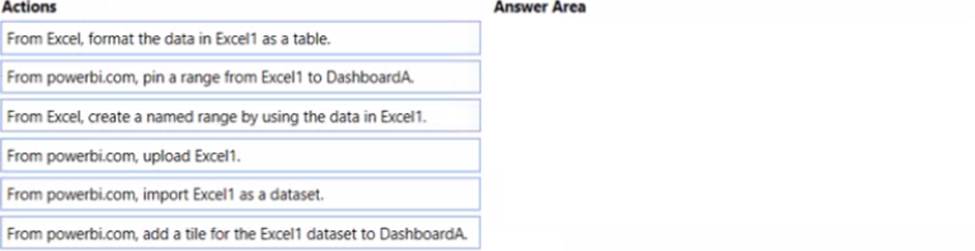
DRAG DROP
You have a Microsoft Exert spreadsheet named Excel1 that contains survey results.
You have a Power Bl dashboard named Dashboard A that has Q&A enabled.
You need to ensure that users who can access Dashboard A can ask Questions based on the contents of Excel 1 and pm visuals based on their queries to Dashboard A. The solution must minimize development time.
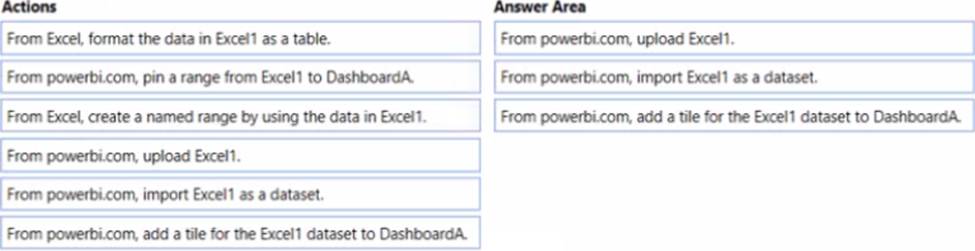
Which three actions should you perform in sequence? To answer, move the appropriate actions from the list of actions to the answer area and arrange them in the correct order.
HOTSPOT
You have the Power Bl data model shown in the following exhibit.
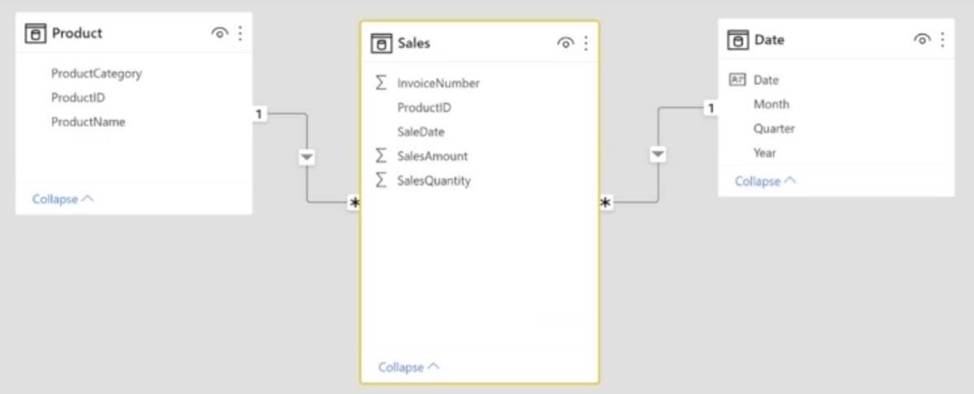
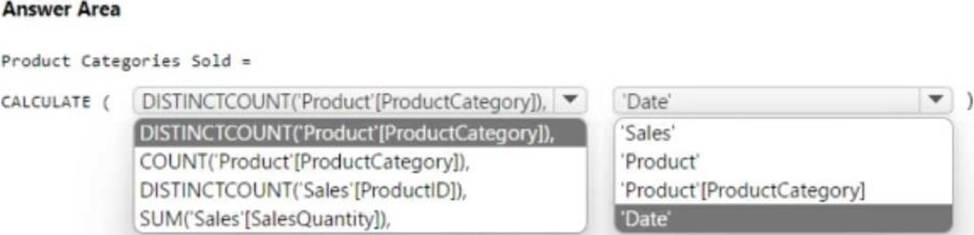
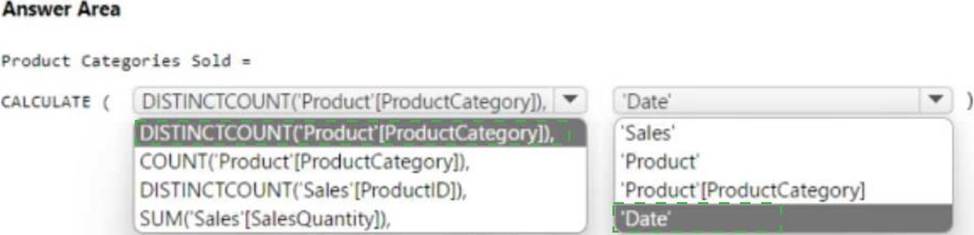
You need to create a measure to count the number of product categories that had products sold during a selected period.
How should you complete the DAX expression? To answer, select the appropriate options in the answer area. NOTE: Each correct selection is worth one point.
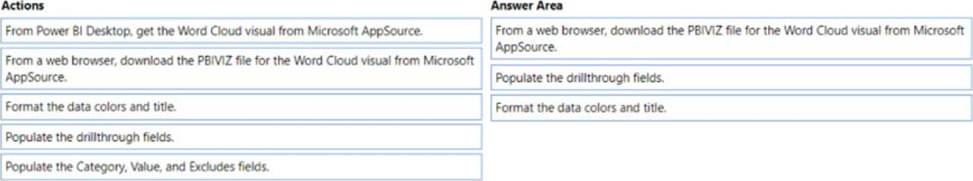
DRAG DROP
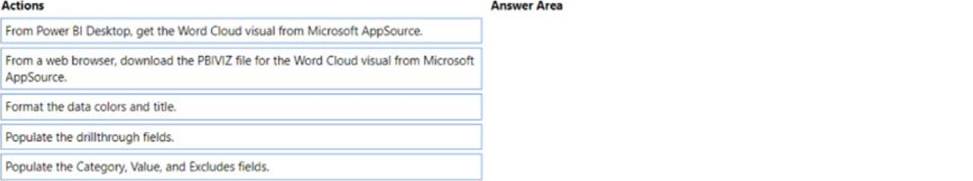
You use Power Bi Desktop to create a Power Bl data model and a blank report.
You need to add the Word Cloud visual shown in the following exhibit to the report.

The solution must minimize development effort
Which three actions should you perform in sequence? To answer, move the appropriate actions from the list of actions to the answer area and arrange them in the correct order.
You have a semantic model named Model1.
You have a Power BI report named RPT1 that is connected to Model1. RPT1 contains a table visual named Table1 that shows the results of multiple measures. You discover that the DAX query for Table1 runs slowly.
You need to identify which measure is slowing query performance.
What should you use?
- A . DAX query view
- B . Power Query Editor
- C . Model view
- D . Performance analyzer
Your organization has a team of power users who recently created 20 Power BI dashboards.
The power users share the dashboards with other users in the organization.
When the users attempt to access the dashboards, they receive the error message shown in the exhibit. (Click the Exhibit.)
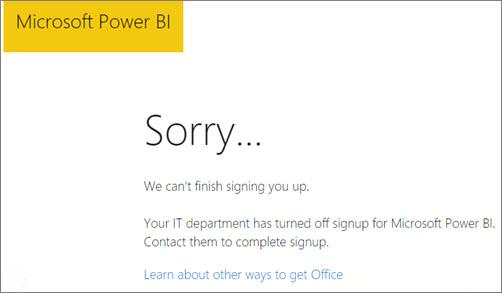
You need to ensure that all the users can access the dashboards.
What should you do first?
- A . From the Microsoft Office 365 Admin center, and the Power BI (free) subscription, and then assign a license to each user.
- B . From the Power BI Admin portal, modify the Privacy Settings.
- C . From the properties of each dashboard, modify the Share dashboard settings.
- D . Instruct each user to install Microsoft Office 2016.
A
Explanation:
Reference: http://www.nubo.eu/en/blog/2016/12/Enable-PowerBI-On-Office-365/
You need to configure access for the sales department users. The solution must me meet the security requirements.
What should you do?
- A . Add the sales department as a member of the reports workspace
- B . Add the Azure Active Directory group of the sales department as an Admin of the reports workspace.
- C . Distribute an app to the users in the Azure Active Directory group of the sales department.
- D . Share each report to the Azure Active Directory group of the sales department.