Practice Free PK0-005 Exam Online Questions
During the project initiation phase, a project manager needs to construct a project schedule and show the project dependencies.
Which of the following should the project manager use for this task?
- A . Waterfall method
- B . Simulation method
- C . Precedence diagramming method
- D . Cost ratio analysis
C
Explanation:
The Precedence Diagramming Method (PDM) is used to visually represent tasks, dependencies, and sequencing in a project schedule. This technique is consistent with CompTIA Project+ guidelines for planning and managing project timelines.
A PM is working with stakeholders in the discovery phase and comparing the cost of the project to the cost savings the project will produce when it is complete.
The output of this exercise will produce the:
- A . ROI.
- B . SOW.
- C . RFI.
- D . RPR
A
Explanation:
The output of this exercise where the project manager is comparing the cost of the project to the cost savings the project will produce when it is complete will produce the return on investment (ROI). ROI is a financial metric that measures the profitability or efficiency of an investment by comparing its benefits or returns to its costs. ROI can help to evaluate the value or worth of a project and support decision making and prioritization. ROI is calculated by dividing the net benefits (benefits minus costs) by the total costs and multiplying by 100 to get a percentage.
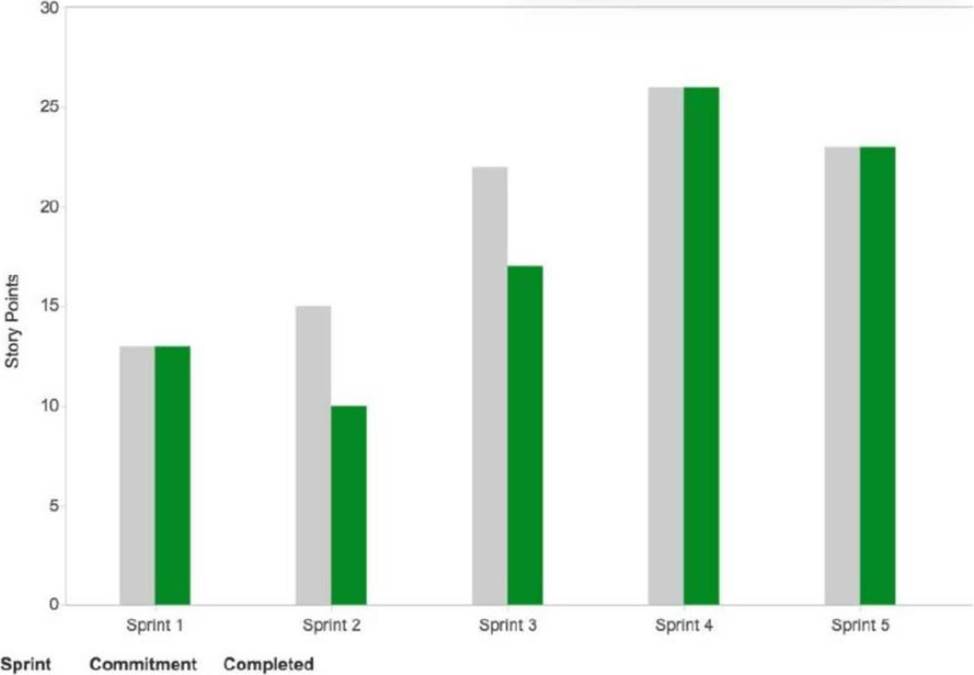
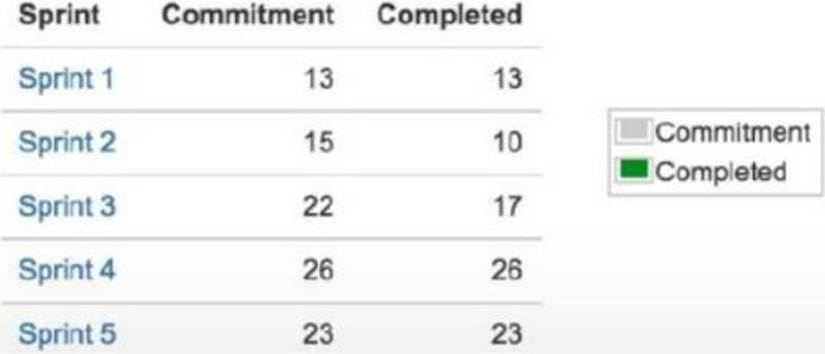
A project manager is monitoring team performance by comparing committed versus completed work.
The project manager creates the following:


Which of the following most likely represents the number of items in the backlog?
- A . 23
- B . 5
- C . 10
- D . 15
A
Explanation:
The number of items in the backlog can be determined by looking at the “Commitment” column for each sprint in the provided chart. For Sprint 5, there is a commitment of completing 23 items, which is the highest among all sprints. This indicates that there are at least 23 items in the backlog to be worked on. This is consistent with the concept of agile project management, which allows for changes and additions to the project scope based on customer feedback and changing requirements.
Reference = CompTIA Project+ PK0-005 Certification Study Guide, Chapter 14: Agile Project Management, page 321. CompTIA Project+ Cert Guide: Exam PK0-005, Chapter 9: Agile Project Management, page 287
During the testing phase of a project, the legal department rejected a deliverable due to compliance issues. The project manager reviewed the risk register and triggered the mitigation plan for this item.
Which of the following documents should the project manager update next?
- A . Schedule
- B . Status report
- C . Issue log
- D . Task board
C
Explanation:
An issue log is a document that records and tracks any issues that arise during a project and how they are resolved1. It is different from a risk register, which records and tracks potential risks that may or may not occur during a project2. When a risk becomes an issue, it means that it has occurred and has a negative impact on the project. Therefore, the project manager should update the issue log next to document the compliance issue, its cause, its impact, its priority, its owner, and its resolution status3. Updating the issue log will help the project manager communicate the issue to the stakeholders, monitor the progress of the mitigation plan, and prevent similar issues from happening again4.
Reference = CompTIA Project+ PK0-005 Certification Study Guide, Chapter 11: Executing Projects Part 2, page 331; Project Risk Mitigation Guide + Starter Kit | Smartsheet, Risk Register section; How to Make a Risk Management Plan (Template Included) – ProjectManager, Risk Register section; Issue Log – Project Management Knowledge, Introduction section; Issue Log Template: Free Download | ProjectManager, Introduction and How to Use an Issue Log sections.
A project manager is reviewing quality planning techniques.
Which of the following involves comparing results of similar activities?
- A . Performing a cost-benefit analysis
- B . Defining metrics
- C . Benchmarking
- D . Brainstorming
C
Explanation:
Benchmarking is a quality technique that compares results, processes, or best practices from similar activities or organizations. It helps set realistic performance standards and identify improvement opportunities. Unlike cost-benefit analysis (financial), benchmarking focuses on performance comparison.
Reference: CompTIA Project+ PK0-005 C Quality Planning Techniques; CompTIA Cloud+ CV0-004 Operations & Support domain.
A project stakeholder has asked the project manager to provide the performance data of a project.
Which of the following should the project manager send to the stakeholder?
- A . Issue log
- B . Dashboard
- C . WBS
- D . Milestone chart
B
Explanation:
A dashboard provides visual, real-time performance data such as KPIs, budget usage, and progress toward deliverables. This helps stakeholders quickly interpret project health. Milestones only show schedule checkpoints, and issue logs track problems, not overall performance.
Reference: CompTIA Project+ PK0-005 C Reporting Tools & Stakeholder Communication; CompTIA
Cloud+ CV0-004 Operations & Support domain.
A company that is implementing an updated version of its main product hired a new project manager to lead the project. Prior to the start of the project, the sponsor asked the project manager to prepare a report on the defects found in the previous project to avoid a decrease in production. The report shows that the two main defects are related to cosmetic and physical damage to the product.
Which of the following charts would BEST prioritize which defects to address?
- A . Pareto
- B . Run
- C . Control
- D . Histogram
A
Explanation:
The project manager should use a Pareto chart to prioritize which defects to address for the product. A Pareto chart is a type of bar chart that shows the frequency or impact of different causes of problems or defects. It also shows a cumulative line that represents the percentage of the total frequency or impact. A Pareto chart can help to prioritize the causes that have the most significant effect on the quality of the product and apply the 80/20 rule, which states that 80% of the problems are caused by 20% of the causes.
During a quality analysis review, the causes of several issues have been highlighted.
Which of the following should the project manager use to identify the MOST important causes?
- A . Ishikawa diagram
- B . Scatter diagram
- C . Pareto chart
- D . Decision tree
C
Explanation:
The Pareto chart should be used to identify the most important causes of issues during a quality analysis review. The Pareto chart is a graphical representation of the frequency and impact of different causes, helping to identify the most common and impactful causes.
Reference: CompTIA Project+ Study Guide Section 3.3.3
A project manager identifies stakeholders who will be impacted when a new product is delivered to the company. The project manager notices that more stakeholders will be positively impacted than negatively impacted.
Which of the following actions should the project manager take?
- A . List both positively and negatively impacted stakeholders.
- B . Update the communication plan with the new findings.
- C . List the negatively impacted stakeholders only.
- D . List the positively impacted stakeholders only.
B
Explanation:
When a project manager identifies stakeholders who will be impacted by the delivery of a new product, it is important to update the communication plan to reflect these findings. This ensures that all stakeholders are informed about the project’s progress and how it may affect them, fostering transparency and managing expectations.
Reference = The answer is based on standard project management practices and the typical use of communication plans in stakeholder management. For detailed information, please refer to the CompTIA Project+ Study Guide and other official CompTIA resources.
Which of the following statements best describes Kanban?
- A . A workflow management method to maximize efficiency and enable continuous improvement.
- B . A board representing the different stages of a software solution.
- C . A dashboard used to facilitate scope alignment with the project team.
- D . A spreadsheet representing development tasks and how they relate to the business process being improved.
A
Explanation:
Kanban is a visual workflow management method that aims to maximize efficiency and promote continuous improvement by visualizing work, limiting work in progress, and enhancing flow.
The CompTIA Project+ PK0-005 exam objectives, under Domain 1.1: Explain the basic characteristics of a project and various methodologies and frameworks used in IT projects, include Kanban as a methodology:
"Methodologies and frameworks: Kanban."
CompTIA Project+ PK0-005 Exam Objectives
Kanban helps teams manage work by visualizing tasks and optimizing the flow from start to finish, aligning with the principles of efficiency and continuous improvement.
