
Practice Free NSE7_SOC_AR-7.6 Exam Online Questions
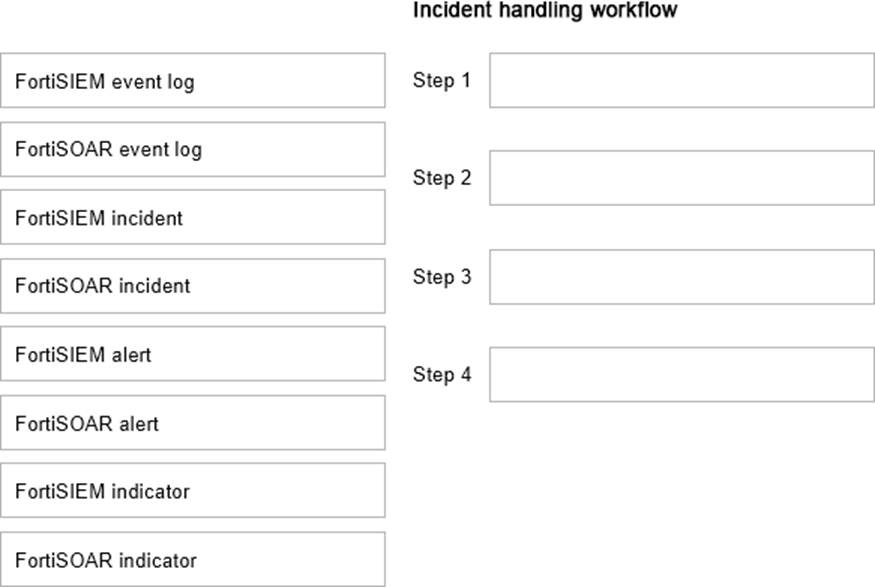
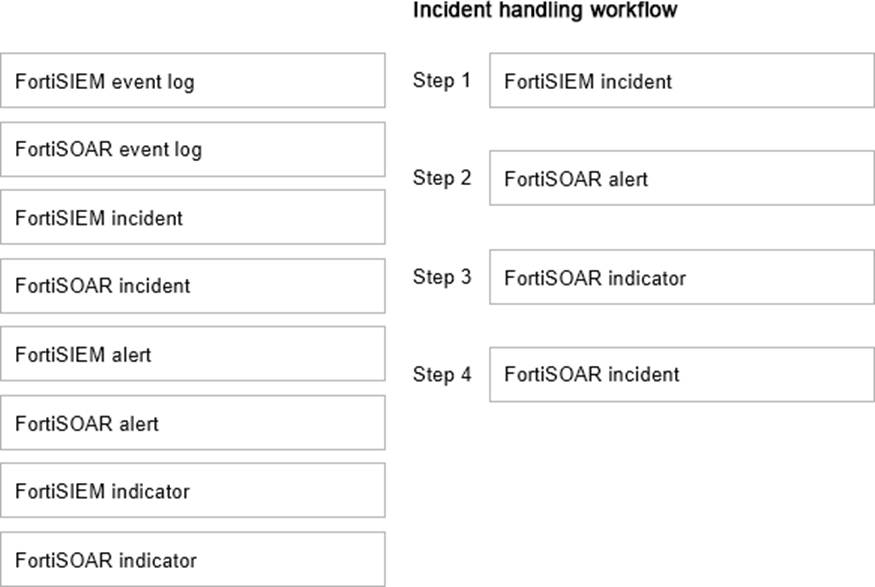
Using the default data ingestion wizard in FortiSOAR, place the incident handling workflow from FortiSIEM to FortiSOAR in the correct sequence. Select each workflow component in the left column, hold and drag it to a blank position in the column on the right. Place the four correct workflow components in order, placing the first step in the first position at the top of the column.
Explanation:
Which two statements about the FortiAnalyzer Fabric topology are true? (Choose two.)
- A . Downstream collectors can forward logs to Fabric members.
- B . Logging devices must be registered to the supervisor.
- C . The supervisor uses an API to store logs, incidents, and events locally.
- D . Fabric members must be in analyzer mode.
B D
Explanation:
Understanding FortiAnalyzer Fabric Topology:
The FortiAnalyzer Fabric topology is designed to centralize logging and analysis across multiple devices in a network.
It involves a hierarchy where the supervisor node manages and coordinates with other Fabric members.
Analyzing the Options:
Option A: Downstream collectors forwarding logs to Fabric members is not a typical configuration. Instead, logs are usually centralized to the supervisor.
Option B: For effective management and log centralization, logging devices must be registered to the supervisor. This ensures proper log collection and coordination.
Option C: The supervisor does not primarily use an API to store logs, incidents, and events locally. Logs are stored directly in the FortiAnalyzer database.
Option D: For the Fabric topology to function correctly, all Fabric members need to be in analyzer mode. This mode allows them to collect, analyze, and forward logs appropriately within the topology.
Conclusion:
The correct statements regarding the FortiAnalyzer Fabric topology are that logging devices must be registered to the supervisor and that Fabric members must be in analyzer mode.
References:
Fortinet Documentation on FortiAnalyzer Fabric Topology.
Best Practices for Configuring FortiAnalyzer in a Fabric Environment.
Exhibit:
Which observation about this FortiAnalyzer Fabric deployment architecture is true?
- A . The AMER HQ SOC team cannot run automation playbooks from the Fabric supervisor.
- B . The AMER HQ SOC team must configure high availability (HA) for the supervisor node.
- C . The EMEA SOC team has access to historical logs only.
- D . The APAC SOC team has access to FortiView and other reporting functions.
A
Explanation:
Understanding FortiAnalyzer Fabric Deployment:
FortiAnalyzer Fabric deployment involves a hierarchical structure where the Fabric root (supervisor) coordinates with multiple Fabric members (collectors and analyzers).
This setup ensures centralized log collection, analysis, and incident response across geographically distributed locations.
Analyzing the Exhibit:
FAZ1-Supervisoris located at AMER HQ and acts as the Fabric root.
FAZ2-Analyzeris a Fabric member located in EMEA.
FAZ3-CollectorandFAZ4-Collectorare Fabric members located in EMEA and APAC, respectively.
Evaluating the Options:
Option A: The statement indicates that the AMER HQ SOC team cannot run automation playbooks from the Fabric supervisor. This is true because automation playbooks and certain orchestration tasks typically require local execution capabilities which may not be fully supported on the supervisor node.
Option B: High availability (HA) configuration for the supervisor node is a best practice for redundancy but is not directly inferred from the given architecture.
Option C: The EMEA SOC team having access to historical logs only is not correct since FAZ2-Analyzer provides full analysis capabilities.
Option D: The APAC SOC team has access to FortiView and other reporting functions through FAZ4-Collector, but this is not explicitly detailed in the provided architecture.
Conclusion:
The most accurate observation about this FortiAnalyzer Fabric deployment architecture is that the AMER HQ SOC team cannot run automation playbooks from the Fabric supervisor.
References:
Fortinet Documentation on FortiAnalyzer Fabric Deployment.
Best Practices for FortiAnalyzer and Automation Playbooks.
When does FortiAnalyzer generate an event?
- A . When a log matches a filter in a data selector
- B . When a log matches an action in a connector
- C . When a log matches a rule in an event handler
- D . When a log matches a task in a playbook
C
Explanation:
Understanding Event Generation in FortiAnalyzer:
FortiAnalyzer generates events based on predefined rules and conditions to help in monitoring and responding to security incidents.
Analyzing the Options:
Option A: Data selectors filter logs based on specific criteria but do not generate events on their own.
Option B: Connectors facilitate integrations with other systems but do not generate events based on log matches.
Option C: Event handlers are configured with rules that define the conditions under which events are generated. When a log matches a rule in an event handler, FortiAnalyzer generates an event.
Option D: Tasks in playbooks execute actions based on predefined workflows but do not directly generate events based on log matches.
Conclusion:
FortiAnalyzer generates an event when a log matches a rule in an event handler.
References:
Fortinet Documentation on Event Handlers and Event Generation in FortiAnalyzer.
Best Practices for Configuring Event Handlers in FortiAnalyzer.
Which two ways can you create an incident on FortiAnalyzer? (Choose two answers)
- A . Using a custom event handler
- B . Using a connector action
- C . Manually, on the Event Monitor page
- D . By running a playbook
A D
Explanation:
From FortiSOAR 7.6., FortiSIEM 7.3 Exact Extract study guide:
InFortiAnalyzer 7.6and related SOC versions, incidents serve as centralized containers for tracking and analyzing security events. There are two primary automated and manual methods to initiate an incident:
Using a custom event handler (A): In FortiAnalyzer, event handlers are used to generate events from raw logs.1A critical feature in recent versions is theAutomatically Create Incidentsetting within a custom event handler.2When enabled, the system automatically elevates a triggered event into a new incident record, allowing analysts to bypass the manual review of every individual event before an incident is raised.3
By running a playbook (D): Playbooks provide a powerful way to automate the incident lifecycle.4A playbook can be configured with anEvent Trigger, meaning it executes as soon as an event matches specific criteria. One of the core actions available within these playbooks is theCreate Incidentaction, which can automatically populate incident details, severity, and category based on the triggering event’s data.5This ensures high-fidelity events are consistently captured for investigation.
Why other options are incorrect:
Using a connector action (B): While connectors allow FortiAnalyzer to communicate with external systems (like ITSM or Security Fabric devices), the act of "creating an incident"insideFortiAnalyzer is a function of the internal event engine or playbook automation, not a standalone connector action used for external integration.
Manually, on the Event Monitor page (C): While you can view, filter, and acknowledge events on theEvent Monitorpage, the process ofmanuallyraising an incident typically occurs from theIncidentsmodule or by right-clicking an event to "Raise Incident" in the Log View or FortiView, rather than being a core function defined as occurring "on the Event Monitor page" in the same architectural sense as handlers and playbooks.
Refer to the exhibit.
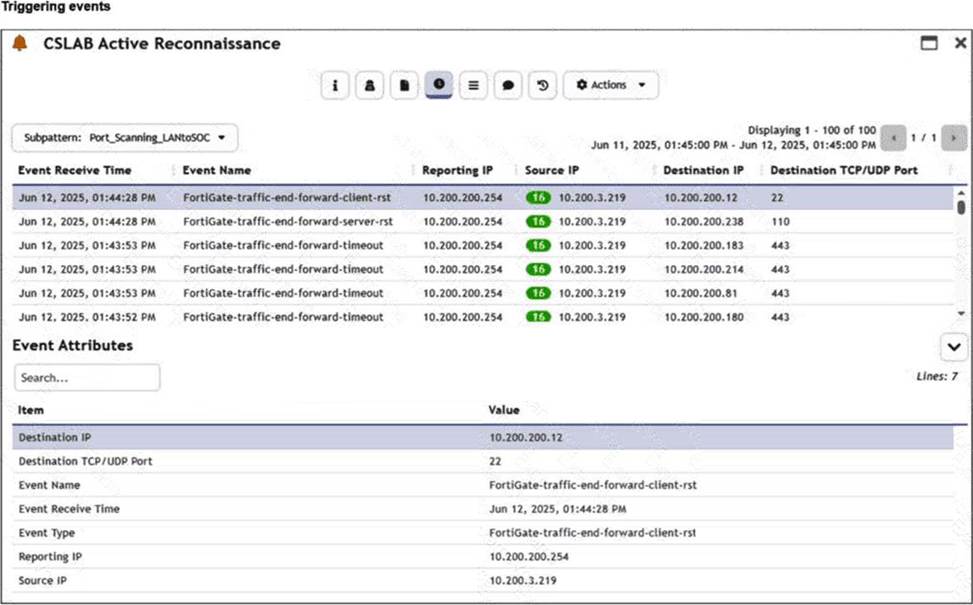
You are reviewing the Triggering Events page for a FortiSIEM incident. You want to remove the Reporting IP column because you have only one firewall in the topology.
How do you accomplish this? (Choose one answer)
- A . Clear the Reporting IP field from the Triggered Attributes section when you configure the Incident Action.
- B . Disable correlation for the Reporting IP field in the rule subpattern.
- C . Remove the Reporting IP attribute from the raw logs using parsing rules.
- D . Customize the display columns for this incident.
D
Explanation:
From FortiSOAR 7.6., FortiSIEM 7.3 Exact Extract study guide:
InFortiSIEM 7.3, theTriggering Eventsview is a dynamic table that displays the individual logs that caused a specific rule to fire. To manage the visibility of data within this specific view:
Interface Customization: The "Triggering Events" tab includes a column management feature. By clicking on the column headers or the table settings icon (typically found at the top right of the event list), an analyst cancustomize the display columns. This allows the user to uncheck the "Reporting IP" attribute, effectively hiding it from the view without altering the underlying data or rule logic.
Operational Efficiency: This is a common task in environments with a simplified topology where the "Reporting IP" is redundant information. Customizing the view helps the analyst focus on the most relevant data points, such as "Source IP," "Destination IP," and "Destination Port."
Why other options are incorrect:
A (Incident Action): Clearing a field from the Incident Action configuration affects what data is sent in an email alert or passed to a SOAR platform, but it does not change the layout of the FortiSIEM GUI "Triggering Events" page.
B (Disable Correlation): Disabling correlation for an attribute determines whether that attribute is used by the rules engine to group events. It does not control the visual display of columns in the incident dashboard.
C (Parsing Rules): Removing attributes via parsing rules is a destructive process that prevents the SIEM from indexing that data entirely. This would make the "Reporting IP" unavailable for all searches and reports, which is excessive for a simple display preference.
Refer to the exhibits.
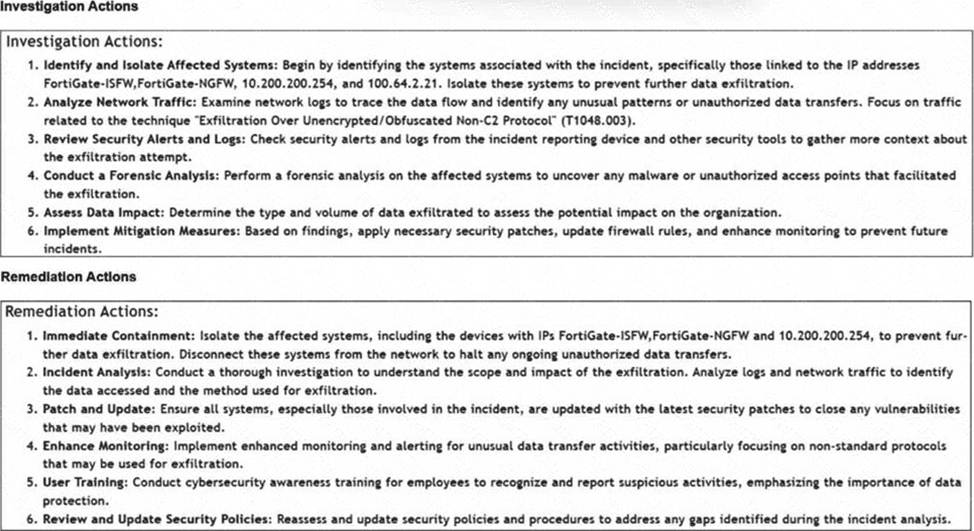
How is the investigation and remediation output generated on FortiSIEM? (Choose one answer)
- A . By exporting an incident
- B . By running an incident report
- C . By using FortiAI to summarize the incident
- D . By viewing the Context tab of an incident
C
Explanation:
From FortiSOAR 7.6., FortiSIEM 7.3 Exact Extract study guide:
InFortiSIEM 7.3, a key innovation is the integration of FortiAI, which provides generative AI capabilities to assist SOC analysts during the triage and response process.
Generative AI Summary: When an incident occurs, FortiAI can automatically analyze the underlying logs, correlation logic, and MITRE ATT&CK techniques (such as "Exfiltration Over Alternative Protocol" shown in the exhibit) to generate a human-readable summary.
Structured Output: The output displayed in the exhibit―specifically the categorized Investigation Actions (identifying affected systems, analyzing traffic) and Remediation Actions (immediate containment, patching, user training)―is the typical result of a FortiAI summary request.
Analyst Efficiency: This feature is designed to reduce the "mean time to respond" (MTTR) by providing analysts with immediate, actionable steps without requiring them to manually piece together the recommended response plan from static documentation or disparate log views.
Why other options are incorrect:
Exporting an incident (A): Exporting an incident typically results in a raw data file (CSV/JSON/PDF) containing the log data and metadata, rather than an AI-generated strategic plan for investigation and remediation.
Running an incident report (B): Standard incident reports provide statistical and historical data about incidents over time. They do not dynamically generate specific, numbered investigation steps tailored to the unique context of a single live incident.
Context tab (D): The Context tab in FortiSIEM is primarily used to view the CMDB information of the involved assets (e.g., host details, owner, location) and related historical events. While it provides the data needed for an investigation, it does not provide the list of actionsto take.
Which role does a threat hunter play within a SOC?
- A . investigate and respond to a reported security incident
- B . Collect evidence and determine the impact of a suspected attack
- C . Search for hidden threats inside a network which may have eluded detection
- D . Monitor network logs to identify anomalous behavior
C
Explanation:
Role of a Threat Hunter:
A threat hunter proactively searches for cyber threats that have evaded traditional security defenses. This role is crucial in identifying sophisticated and stealthy adversaries that bypass automated detection systems.
Key Responsibilities:
Proactive Threat Identification:
Threat hunters use advanced tools and techniques to identify hidden threats within the network. This includes analyzing anomalies, investigating unusual behaviors, and utilizing threat intelligence.
Reference: SANS Institute, "Threat Hunting: Open Season on the Adversary" SANS Threat Hunting
Understanding the Threat Landscape:
They need a deep understanding of the threat landscape, including common and emerging tactics, techniques, and procedures (TTPs) used by threat actors.
Reference: MITRE ATT&CK Framework MITRE ATT&CK
Advanced Analytical Skills:
Utilizing advanced analytical skills and tools, threat hunters analyze logs, network traffic, and endpoint data to uncover signs of compromise.
Reference: Cybersecurity and Infrastructure Security Agency (CISA) Threat Hunting Guide CISA Threat Hunting
Distinguishing from Other Roles:
Investigate and Respond to Incidents (A):
This is typically the role of an Incident Responder who reacts to reported incidents, collects evidence, and determines the impact.
Reference: NIST Special Publication 800-61, "Computer Security Incident Handling Guide"NIST Incident Handling
Collect Evidence and Determine Impact (B):
This is often the role of a Digital Forensics Analyst who focuses on evidence collection and impact assessment post-incident.
Monitor Network Logs (D):
This falls under the responsibilities of a SOC Analyst who monitors logs and alerts for anomalous behavior and initial detection.
Conclusion:
Threat hunters are essential in a SOC for uncovering sophisticated threats that automated systems may miss.
Their proactive approach is key to enhancing the organization’s security posture.
References:
SANS Institute, "Threat Hunting: Open Season on the Adversary"
MITRE ATT&CK Framework
CISA Threat Hunting Guide
NIST Special Publication 800-61, "Computer Security Incident Handling Guide"
By searching for hidden threats that elude detection, threat hunters play a crucial role in maintaining the security and integrity of an organization’s network.
Refer to the exhibit.
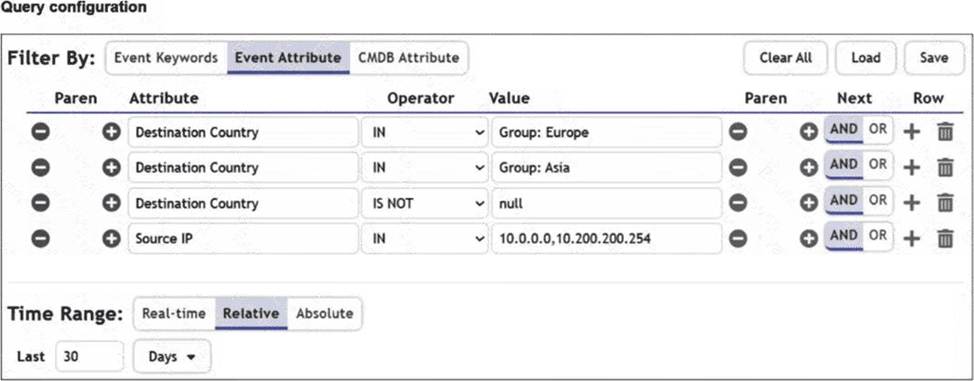
You are trying to find traffic flows to destinations that are in Europe or Asia, for hosts in the local LAN segment. However, the query returns no results. Assume these logs exist on FortiSIEM.
Which three mistakes can you see in the query shown in the exhibit? (Choose three answers)
- A . The null value cannot be used with the IS NOT operator.
- B . The time range must be Absolute for queries that use configuration management database (CMDB) groups.
- C . There are missing parentheses between the first row (Group: Europe) and the second row (Group: Asia).
- D . The Source IP row operator must be BETWEEN 10.0.0.0, 10.200.200.254.
- E . The logical operator for the first row (Group: Europe) must be OR.
C D E
Explanation:
From FortiSOAR 7.6., FortiSIEM 7.3 Exact Extract study guide:
Analyzing the Query Configuration exhibit in the context of FortiSIEM 7.3 search logic reveals several syntax and logical errors that prevent the query from returning results:
Logical Operator Error (E): The user intends to find traffic to Europe OR Asia. In the exhibit, the first row (Group: Europe) is followed by a default AND operator. This forces the query to look for a single flow where the destination is simultaneously in Europe and Asia, which is logically impossible. It must be changed to OR.
Missing Parentheses (C): When combining OR and AND logic in FortiSIEM, parentheses are required to define the order of operations. Without them, the query might evaluate "Asia AND Destination Country IS NOT null AND Source IP IN…" first. To correctly find (Europe OR Asia) that also matches the LAN segment, parentheses must group the first two rows.
Incorrect Operator for IP Range (D): The exhibit uses the IN operator for the value 10.0.0.0,