
Practice Free FCSS_NST_SE-7.6 Exam Online Questions
Refer to the exhibit showing a debug output.
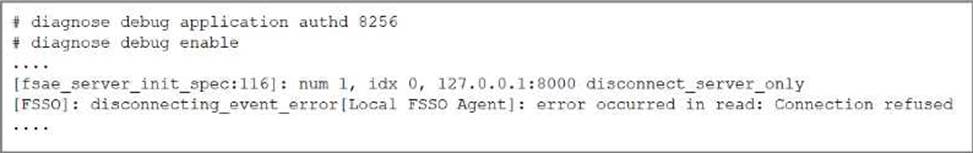
An administrator deployed FSSO in DC Agent Mode but FSSO is failing on FortiGate.
Pinging FortiGate from where the collector agent is deployed is successful.
The administrator then produces the debug output shown in the exhibit.
What could be causing this error message?
- A . The TCP port 445 is blocked between FortiGate and collector agent.
- B . The collector agent preshared password is mismatched.
- C . The FortiGate cannot resolve the active directory server name.
- D . The FortiGate and the collector agent are using different TCP ports.
Refer to the exhibit, which shows partial outputs from two routing debug commands.
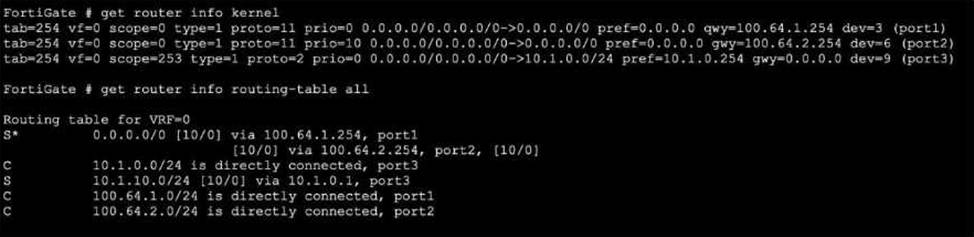
Which change must an administrator make on FortiGate to route web traffic from internal users to the internet, using ECMP?
- A . Set snat-route-change to enable.
- B . Set the priority of the static default route using port2 to 1.
- C . Set preserve-session-route to enable.
- D . Set the priority of the static default route using port1 to 10.
What is an accurate description of LDAP authentication using the regular bind type?
- A . The regular bind requires the client to send the full distinguished name (ON).
- B . The regular bind type is the easiest bind type to configure on ForbOS.
- C . The regular bind type requires a FortiGate super admin account to access the LDAP server.
- D . It is not often used as a bind type
A
Explanation:
Here is the detailed breakdown of why A is the intended answer and why the other options are incorrect based on the Regular Bind process: Analysis of Regular Bind (The Verified Process):
Definition: The Regular bind type is the most versatile and commonly used method. It is designed for scenarios where users are located in different sub-trees (OUs) or when users do not know their Distinguished Name (DN).
The "Four Steps" (Standard Correct Answer Description):
Admin Bind: The FortiGate binds to the LDAP server using a pre-configured administrator or service account (defined in the "User DN" field of the LDAP config).
Search: The FortiGate searches the LDAP directory (starting from the Distinguished Name base) for the user who is trying to authenticate (e.g., searching for sAMAccountName=jsmith).
Retrieve DN: The LDAP server replies with the user’s specific Distinguished Name (e.g., CN=John Smith,OU=Sales,DC=example,DC=com).
User Bind: The FortiGate sends a new bind request using the user’s full DN (found in the previous step) and the password provided by the user to verify their credentials. Evaluating Your Specific Options:
Refer to the exhibit, which contains the output of diagnose vpn tunnel list.
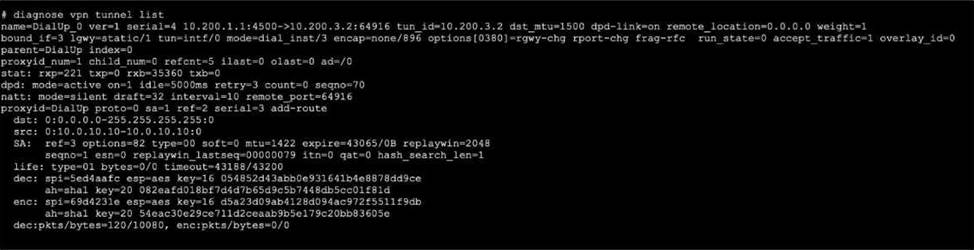
Which command will capture ESP traffic for the VPN named DialUp_0?
- A . diagnose sniffer packet any ‘ip proto 50’
- B . diagnose sniffer packet any ‘host 10.0.10.10’
- C . diagnose sniffer packet any ‘esp and host 10.200.3.2’
- D . diagnose sniffer packet any ‘port 4500’
Refer to the exhibit, which shows the partial output of a real-time OSPF debug.
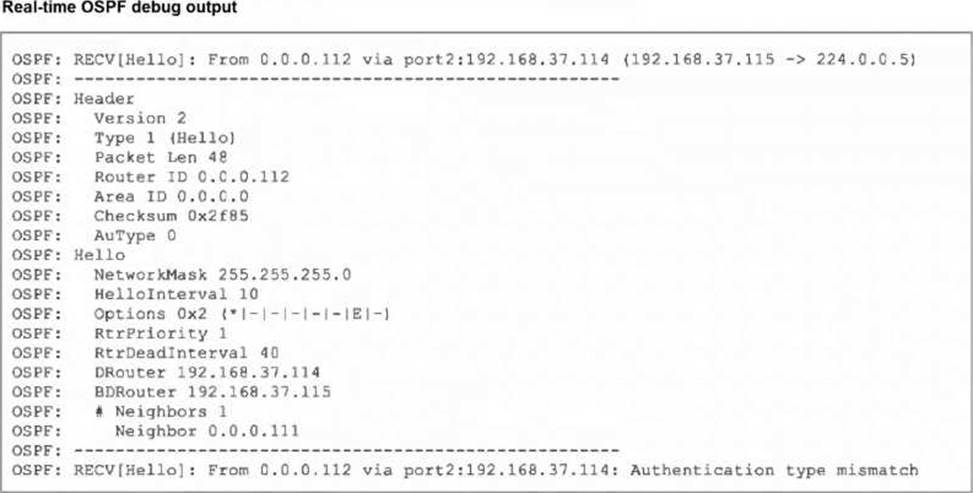
Why are the two FortiGate devices unable to form an adjacency?
- A . The Hello packet is being sent from an OSPF router with ID 0.0.0.112.
- B . The two FortiGate devices attempting adjacency are in area 0.0.0.0.
- C . One FortiGate device is configured to require authentication, while the other is not.
- D . The passwords on the FortiGate devices do not match.
Which two statements about Security Fabric communications are true? (Choose two.)
- A . FortiTelemetry and Neighbor Discovery both operate using TCP.
- B . The default port for Neighbor Discovery can be modified.
- C . FortiTelemetry must be manually enabled on the FortiGate interface.
- D . By default, the downstream FortiGate establishes a connection with the upstream FortiGate using TCP port 8013.
C,D
Explanation:
FortiTelemetry is a critical part of Security Fabric communications and requires explicit configuration for each participating FortiGate interface. The administrative access setting "fabric" (corresponding to FortiTelemetry) must be manually enabled per interface on both upstream and downstream devices. This is performed in the GUI under Administrative Access or via the CLI using the command set allowaccess fabric for the relevant network interface. Without this step, FortiTelemetry communications will not occur on that interface.
Additionally, the default communication between downstream and upstream FortiGate units in the Security Fabric is over TCP port 8013. This port is well-documented as the standard for Security Fabric and FortiTelemetry connections, and must be open and permitted across the network path for connectivity and status enforcement between units. The downstream FortiGate initiates the connection to the upstream via this port unless otherwise configured. This has also been documented as a PCI-relevant port, showing its default usage.
Other options:
Neighbor Discovery in FortiOS uses IPv6 ND protocol, not TCP.
FortiTelemetry port (8013) can be modified, but the interface Administrative Access for the Security Fabric must be manually enabled; Neighbor Discovery port modification is not documented as a supported change for FortiGate.
Reference: FortiGate/FortiOS Administration Guide: Enabling FortiTelemetry (fabric) on interfaces Fortinet Technical Tip: FortiTelemetry uses TCP port 8013 by default PCI compliance documentation on port 8013 usage for Security Fabric Fortinet Security Fabric setup procedures and interface options
Refer to the exhibit, which shows the output of a BGP debug command.
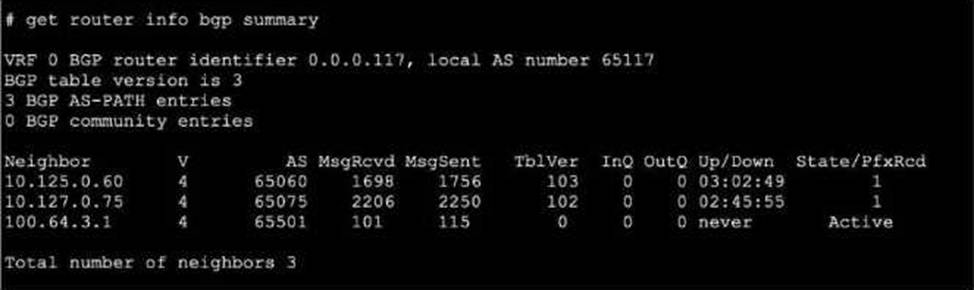
What can you conclude about the router in this scenario?
- A . The router 100.64.3.1 needs to update the local AS number in its BGP configuration in order to bring up the 8GP session with the local router.
- B . An inbound route-map on local router is blocking the prefixes from neighbor 100.64.3.1.
- C . All of the neighbors displayed are part of a single BGP configuration on the local router with the neighbor-range set to a value of 4.
- D . The BGP session with peer 10.127.0.75 is up.
D
Explanation:
The BGP debug output shows session information for peers, including state details. According to official Fortinet BGP documentation, if the session state with a peer does not show "Idle," "Active," or "Connect," but instead shows "Established," "Up," or related counters (e.g., messages sent/received or uptime), it indicates the session is operational. In this scenario, the peer 10.127.0.75 is the only one showing a positive indication of a live, established session. Other options like neighbor-range configuration, AS mismatch, or route-maps blocking prefixes are not supported by evidence provided in a simple BGP session state debug, nor does the output show errors relating to local or remote AS issues.
The correct interpretation comes from Fortinet’s BGP troubleshooting guide, which outlines how to read session status and neighbor states in debug and summary outputs.
Reference: FortiOS BGP Debugging Guide: Session State Interpretation
BGP CLI
Reference: Neighbor Status Fields
Exhibit.
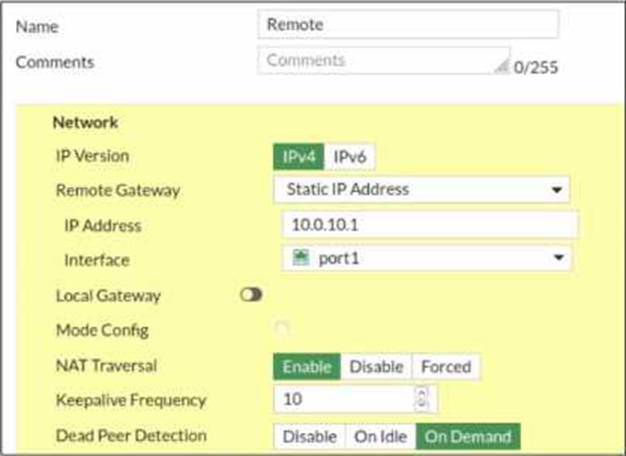
Refer to the exhibit, which contains a screenshot of some phase 1 settings.
The VPN is not up. To diagnose the issue, the administrator enters the following CLI commands on an SSH session on FortiGate:
![]()
However, the IKE real-time debug does not show any output.
Why?
- A . The administrator must also run the command diagnose debug enable.
- B . The debug shows only error messages. If there is no output, then the phase 1 and phase 2 configurations match.
- C . The log-filter setting is incorrect. The VPN traffic does not match this filter.
- D . Replace diagnose debug application ike -1 with diagnose debug application ipsec -1.
A
Explanation:
To display debug output on FortiGate devices, you must always run both the application-specific debug command and the global debug enable command. The command diagnose debug application ike -1 sets up the detail level for the IKE daemon debug, but it does not display any debug output on its own. As described in the FortiOS CLI debugging manuals, the command diagnose debug enable activates debug output on the console, making all previously set debugs visible. This is especially important for VPN troubleshooting―without the enable command, no output appears even if there is VPN traffic. The correct diagnostic sequence is:
diagnose debug application ike -1
diagnose debug enable
This procedure is found in every FortiOS CLI debug tutorial and troubleshooting workflow.
Reference: FortiOS CLI
Reference: Debugging VPNs and Real-time Debug Output
FortiGate VPN Troubleshooting Guide: Required Steps for Debug Output
Refer to the exhibit, which shows the output of get router info ospf neighbor.
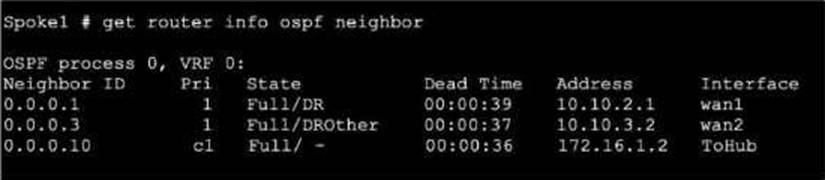
What can you conclude from the command output?
- A . The network type connecting the local Fortigate and OSPF neighbor 0.0.0.10 is point-to-point.
- B . All neighbors are in area 0.0.0.0.
- C . The local FortiGate is the BDR.
- D . The local FortiGate is not a DROther.
Refer to the exhibit, which shows the output of diagnose sys session list.
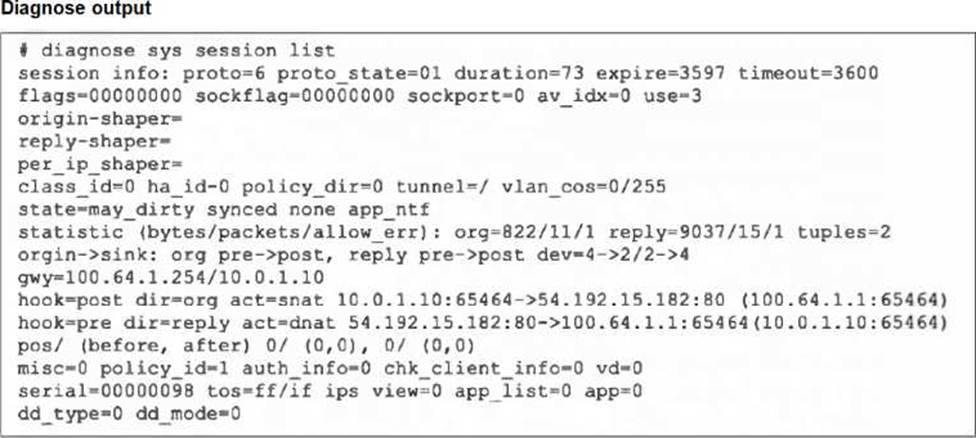
If the HA ID for the primary device is 0, what happens if the primary fails and the secondary becomes the primary?
- A . The secondary device has this session synchronized; however, because application control is applied, the session is marked dirty and has to be re-evaluated after failover.
- B . Traffic for this session continues to be permitted on the new primary device after failover, without requiring the client to restart the session with the server.
- C . The session will be removed from the session table of the secondary device because of the presence of allowed error packets, which will force the client to restart the session with the server.
- D . The session state is preserved but the kernel will need to re-evaluate the session because NAT was applied.