
Practice Free FCP_FAZ_AN-7.6 Exam Online Questions
You need to move reports between two ADOMs.
Which two statements are true? (Choose two.)
- A . The ADOMs must be compatible types.
- B . The date and time will be appended to the original report name to avoid conflicts.
- C . All charts and datasets associated with the report will be imported together.
- D . You need to convert the reports into templates first.
A, C
Explanation:
Comprehensive and Detailed Explanation From Exact Extract of knowledge of FortiAnalyzer 7.6 Study guide documents:
FortiAnalyzer supports moving reporting content across ADOMs by importing/exporting reporting objects, but it enforces ADOM compatibility. The study guide states: “You can, however, import and export reports and charts … into different ADOMs …” and explicitly requires that “Both ADOMs must be of the same type.” This directly validates statement A.
For report dependencies, the study guide clarifies how datasets are handled during transfer. While “You can’t export templates and datasets,” it also explains that when you export a chart, “the associated dataset is exported with it, so when you import an exported chart, the associated dataset is imported as well.” Since reports are composed of charts (and charts depend on datasets), moving a report between ADOMs entails moving its charts; when those charts are exported/imported, their datasets come with them. This supports statement C based on the documented chart→dataset import/export behavior.
Statement D is not required because the study guide explicitly indicates you can “export and import reports” directly, and additionally notes that on import “you can save the layout of the report as a template” (optional, not a prerequisite).
Which SQL query is in the correct order to query to database in the FortiAnalyzer?
- A . SELECT devid FROM $log GROUP BY devid WHERE ‘user’,,’ users1’
- B . SELECT FROM $log WHERE devid ‘user’,, USER1’ GROUP BY devid
- C . SELCT devid WHERE ’user’-‘ USER1’ FROM $log GROUP By devid
- D . SELECT devid FROM $log WHERE ‘user’=’ GROUP BY devid
D
Explanation:
In FortiAnalyzer’s SQL query syntax, the typical order for querying the database follows the standard SQL format, which is:
SELECT <column(s)> FROM <table> WHERE <condition(s)> GROUP BY <column(s)>
Option D correctly follows this structure:
SELECT devid FROM $log: This specifies that the query is selecting the devid column from the $log table.
WHERE ‘user’ = ‘: This part of the query is intended to filter results based on a condition involving the user column. Although there appears to be a minor typographical issue (possibly missing the user value after =), it structurally adheres to the correct SQL order.
GROUP BY devid: This groups the results by devid, which is correctly positioned at the end of the query.
Let’s briefly examine why the other options are incorrect:
Option A: SELECT devid FROM $log GROUP BY devid WHERE ‘user’, ‘users1’
This is incorrect because the GROUP BY clause appears before the WHERE clause, which is out of order in SQL syntax.
Option B: SELECT FROM $log WHERE devid ‘user’, USER1′ GROUP BY devid
This is incorrect because it lacks a column in the SELECT statement and the WHERE clause syntax is malformed.
Option C: SELCT devid WHERE ‘user’ – ‘USER1’ FROM $log GROUP BY devid
This is incorrect because the SELECT keyword is misspelled as SELCT, and the WHERE condition syntax is invalid.
Reference: FortiAnalyzer documentation for SQL queries indicates that the standard SQL order should be followed when querying logs in FortiAnalyzer. Queries should follow the format SELECT … FROM … WHERE … GROUP BY …, as demonstrated in option D.
Which statement about exporting items in Report Definitions is true?
- A . Templates can be exported.
- B . Template exports contain associated charts and datasets.
- C . Chart exports contain associated datasets.
- D . Datasets can be exported.
Refer to the exhibit.
Which statement about the displayed event is correct? (Choose one answer)
- A . The security risk was dropped.
- B . The risk source is isolated.
- C . The security risk was blocked.
- D . The security event risk is from an application control log.
C
Explanation:
Comprehensive and Detailed Explanation From Exact Extract of knowledge of FortiAnalyzer 7.6 Study guide documents:
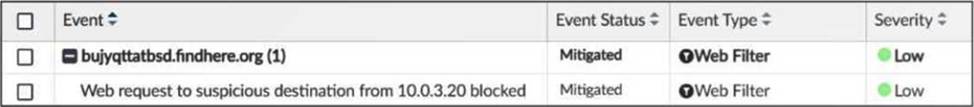
The exhibit shows the event Event Status = Mitigated and Event Type = Web Filter, with the event message indicating the web request was blocked.
The study guide defines Mitigated events as follows: “Mitigated: The security risk is mitigated by being blocked or dropped.” This means a mitigated status corresponds to enforcement that prevented the risk (block/drop), not a condition where the source is isolated.
It also distinguishes Contained events from mitigated ones: “Contained: The risk source is isolated.” Since the exhibit clearly shows Mitigated (not Contained), option B is incorrect.
Additionally, the study guide notes: “Generally, you can acknowledge mitigated events because the related traffic was blocked by the firewall.” This aligns directly with the exhibit’s “blocked” wording and supports that the correct interpretation is that the security risk was blocked.
Finally, the event type displayed is Web Filter, not application control, so option D is incorrect.
Therefore, the correct statement is C. The security risk was blocked.
Exhibit.
What can you conclude about the output?
- A . The message rate being lower that the log rate is normal.
- B . Both messages and logs are almost finished indexing.
- C . There are more traffic logs than event logs.
- D . The output is ADOM specific
A
Explanation:
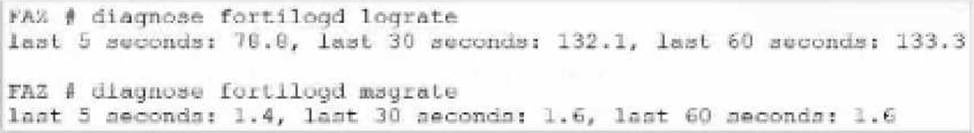
In this output, we see two diagnostic commands executed on a FortiAnalyzer device:
diagnose fortilogd lograte: This command shows the rate at which logs are being processed by the FortiAnalyzer in terms of log entries per second.
diagnose fortilogd msgrate: This command displays the message rate, or the rate at which individual messages are being processed.
The values provided in the exhibit output show:
Log rate (lograte): Consistently high, showing values such as 70.0, 132.1, and 133.3 logs per second over different time intervals.
Message rate (msgrate): Lower values, around 1.4 to 1.6 messages per second.
Explanation
Interpretation of log rate vs. message rate: In FortiAnalyzer, the log rate typically refers to the rate of logs being stored or indexed, while the message rate refers to individual messages within these logs. Given that a single log entry can contain multiple messages, it’s common to see a lower message rate relative to the log rate.
Understanding normal operation: In this case, the message rate being lower than the log rate is expected and typical behavior. This discrepancy can arise because each log entry may bundle multiple related messages, reducing the message rate relative to the log rate.
Conclusion
Correct Answer
An analyst is using FortiAI on FortiAnalyzer to simplify certain tasks but is worried about exceeding the monthly token limit.
Which query will take the fewest FortiAI tokens? (Choose one answer)
- A . Show logs for 192.168.1.10 (past week)
- B . Show all logs from the past week
- C . Can you show me all the log entries for the endpoint 192.168.1.10?
- D . Show logs for 192.168.1.10
A
Explanation:
Comprehensive and Detailed Explanation From Exact Extract of knowledge of FortiAnalyzer 7.6 Study guide documents:
The study guide explains that FortiAI token usage includes both the prompt (input) and the response (output), and that “generally, more text in the query and response results in using more tokens.” It provides two comparison examples and concludes that the more verbose request for “all the log entries” consumes more tokens because it has more text and also triggers a larger response; whereas limiting the query to a time range (for example, “(past week)”) reduces output volume and therefore token usage.
Applying that guidance to the options:
C is the most verbose and explicitly requests “all the log entries,” which drives higher input and output token usage.
B requests “all logs” for the week (broad scope), which typically increases output tokens.
D is short, but it does not constrain the time range, which can increase the response size (output tokens).
A is concise and includes a time constraint “(past week),” matching the study guide’s example of a lower-token query pattern.
Which two statements about exporting and importing playbacks are true? (Choose two.)
- A . A playbook that was disabled when it was exported mil be disabled when it is imported.
- B . Playbooks can so imported 10 a different FortiAnayzer device, but only if the connectors already exist
- C . You can import a playbook even if there is another one win the same name in the destination
- D . You can export only one playbook at a time.
Exhibit.

Which statement about the event displayed is correct?
- A . The risk source is isolated.
- B . The security risk was blocked or dropped.
- C . The security event risk is considered open.
- D . An incident was created from this event.
You find that as part of your role as an analyst, you frequently search log View using the same parameters.
Instead of defining your search filters repeatedly, what can you do to save time?
- A . Configure a custom dashboard.
- B . Configure a custom view.
- C . Configure a data selector.
- D . Configure a marco and apply it to device groups.
B
Explanation:
When you frequently use the same search parameters in FortiAnalyzer’s Log View, setting up a reusable filter or view can save considerable time.
Here’s an analysis of each option:
Option A – Configure a Custom Dashboard:
Custom dashboards are useful for displaying a variety of widgets and summaries on network activity, performance, and threat data, but they are not designed for storing specific search filters for log views.
Conclusion: Incorrect.
Option B – Configure a Custom View:
Custom views in FortiAnalyzer allow analysts to save specific search filters and configurations. By setting up a custom view, you can retain your frequently used search parameters and quickly access them without needing to reapply filters each time. This option is specifically designed to streamline the process of recurring log searches.
Conclusion: Correct.
Option C – Configure a Data Selector:
Data selectors are used to define specific types of data for FortiAnalyzer reports and widgets. They are useful in reports but are not meant for saving and reusing log search parameters in Log View.
Conclusion: Incorrect.
Option D – Configure a Macro and Apply It to Device Groups:
Macros in FortiAnalyzer are generally used for automation tasks, not for saving log search filters. Applying macros to device groups does not fulfill the requirement of saving specific log view search parameters.
Conclusion: Incorrect.
Conclusion:
Correct Answer
B. Configure a custom view.
Custom views allow you to save specific search filters, enabling quick access to frequently used parameters in Log View.
Reference: FortiAnalyzer 7.4.1 documentation on creating and using custom views for log searches.
Why must you wait for several minutes before you run a playbook that you just created?
- A . FortiAnalyzer needs that time to parse the new playbook.
- B . FortiAnalyzer needs that time to debug the new playbook.
- C . FortiAnalyzer needs that time to back up the current playbooks.
- D . FortiAnalyzer needs that time to ensure there are no other playbooks running.
A
Explanation:
When a new playbook is created on FortiAnalyzer, the system requires some time to parse and validate the playbook before it can be executed. Parsing involves checking the playbook’s structure, ensuring that all syntax and logic are correct, and preparing the playbook for execution within FortiAnalyzer’s automation engine. This initial parsing step is necessary for FortiAnalyzer to load the playbook into its operational environment correctly.
Here’s why the other options are incorrect:
Option A: FortiAnalyzer needs that time to parse the new playbook
This is correct. The delay is due to the parsing and setup process required to prepare the new playbook for execution. FortiAnalyzer’s automation engine checks for any issues or dependencies within the playbook, ensuring that it can run without errors.
Option B: FortiAnalyzer needs that time to debug the new playbook
This is incorrect. Debugging is not an automatic process that FortiAnalyzer undertakes after playbook creation. Debugging, if necessary, is a manual task performed by the administrator if there are issues
with the playbook execution.
Option C: FortiAnalyzer needs that time to back up the current playbooks
This is incorrect. FortiAnalyzer does not automatically back up playbooks every time a new one is created. Backups of configuration and playbooks are typically scheduled as part of routine maintenance and are not triggered by playbook creation.
Option D: FortiAnalyzer needs that time to ensure there are no other playbooks running
This is incorrect. FortiAnalyzer can manage multiple playbooks running simultaneously, so it does not require waiting for other playbooks to finish before initiating a new one. The waiting time specifically relates to the parsing process of the newly created playbook.
Reference: FortiAnalyzer documentation states that after creating a playbook, a brief delay is expected as the system parses and validates the playbook. This ensures that any syntax errors or logical inconsistencies are resolved before the playbook is executed, making option A the correct answer.