
Practice Free Databricks Certified Data Analyst Associate Exam Online Questions
Which of the following describes how Databricks SQL should be used in relation to other business intelligence (BI) tools like Tableau, Power BI, and looker?
- A . As an exact substitute with the same level of functionality
- B . As a substitute with less functionality
- C . As a complete replacement with additional functionality
- D . As a complementary tool for professional-grade presentations
- E . As a complementary tool for quick in-platform Bl work
E
Explanation:
Databricks SQL is not meant to replace or substitute other BI tools, but rather to complement them by providing a fast and easy way to query, explore, and visualize data on the lakehouse using the built-in SQL editor, visualizations, and dashboards. Databricks SQL also integrates seamlessly with popular BI tools like Tableau, Power BI, and Looker, allowing analysts to use their preferred tools to access data through Databricks clusters and SQL warehouses. Databricks SQL offers low-code and no-code experiences, as well as optimized connectors and serverless compute, to enhance the productivity and performance of BI workloads on the lakehouse.
Reference: Databricks SQL, Connecting Applications and BI Tools to Databricks SQL, Databricks integrations
overview, Databricks SQL: Delivering a Production SQL Development Experience on the Lakehouse
Which of the following is an advantage of using a Delta Lake-based data lakehouse over common data lake solutions?
- A . ACID transactions
- B . Flexible schemas
- C . Data deletion
- D . Scalable storage
- E . Open-source formats
A
Explanation:
A Delta Lake-based data lakehouse is a data platform architecture that combines the scalability and flexibility of a data lake with the reliability and performance of a data warehouse. One of the key advantages of using a Delta Lake-based data lakehouse over common data lake solutions is that it supports ACID transactions, which ensure data integrity and consistency. ACID transactions enable concurrent reads and writes, schema enforcement and evolution, data versioning and rollback, and data quality checks. These features are not available in traditional data lakes, which rely on file-based storage systems that do not support transactions.
Reference: Delta Lake: Lakehouse, warehouse, advantages | Definition Synapse C Data Lake vs. Delta Lake vs. Data Lakehouse Data Lake vs. Delta Lake – A Detailed Comparison
Building a Data Lakehouse with Delta Lake Architecture: A Comprehensive Guide
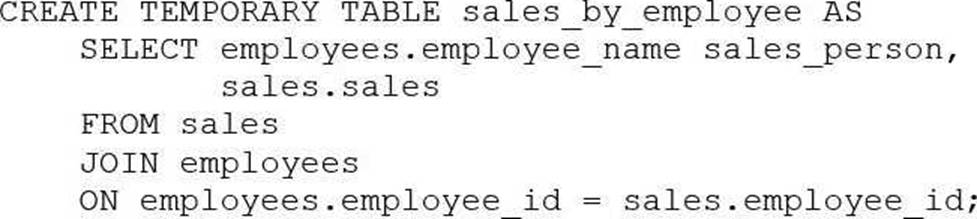
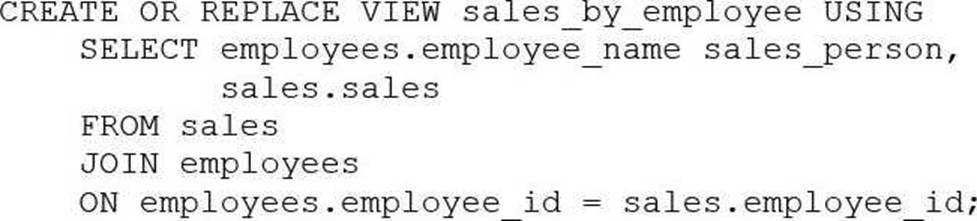
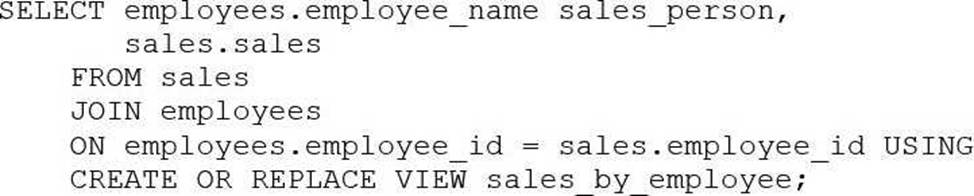
A business analyst has been asked to create a data entity/object called sales_by_employee. It should always stay up-to-date when new data are added to the sales table. The new entity should have the columns sales_person, which will be the name of the employee from the employees table, and sales, which will be all sales for that particular sales person. Both the sales table and the employees table have an employee_id column that is used to identify the sales person.
Which of the following code blocks will accomplish this task?
A)
B)
C)
D)

- A . Option A
- B . Option B
- C . Option C
- D . Option D
D
The SQL code provided in Option D is the correct way to create a view
named sales_by_employee that will always stay up-to-date with the sales and employees tables. The code uses the CREATE OR REPLACE VIEW statement to define a new view that joins the sales and employees tables on the employee_id column. It selects the employee_name as sales_person and all sales for each employee, ensuring that the data entity/object is always up-to-date when new data are added to these tables.
Reference: The answer can be verified from Databricks SQL documentation which provides insights on creating views using SQL queries, joining tables, and selecting specific columns to be included in the view. Reference link: Databricks SQL
What does Partner Connect do when connecting Power Bl and Tableau?
- A . Creates a Personal Access Token. downloads and installs an ODBC driver, and downloads a configuration file for connection by Power Bl or Tableau to a SQL Warehouse (formerly known as a SQL Endpoint).
- B . Creates a Personal Access Token for authentication into Databricks SQL and emails it to you.
- C . Downloads a configuration file for connection by Power Bl or Tableau to a SQL Warehouse (formerly known as a SQL Endpoint).
- D . Downloads and installs an ODBC driver.
A
Explanation:
When connecting Power BI and Tableau through Databricks Partner Connect, the system automates several steps to streamline the integration process:
Personal Access Token Creation: Partner Connect generates a Databricks personal access token, which is essential for authenticating and establishing a secure connection between Databricks and the BI tools.
ODBC Driver Installation: The appropriate ODBC driver is downloaded and installed. This driver facilitates communication between the BI tools and Databricks, ensuring compatibility and optimal performance.
Configuration File Download: A configuration file tailored for the selected BI tool (Power BI or Tableau) is provided. This file contains the necessary connection details, simplifying the setup process within the BI tool.
By automating these steps, Partner Connect ensures a seamless and efficient integration, reducing manual configuration efforts and potential errors.
Reference: Connect Tableau and Databricks
A stakeholder has provided a data analyst with a lookup dataset in the form of a 50-row CSV file. The data analyst needs to upload this dataset for use as a table in Databricks SQL.
Which approach should the data analyst use to quickly upload the file into a table for use in Databricks SOL?
- A . Create a table by uploading the file using the Create page within Databricks SQL
- B . Create a table via a connection between Databricks and the desktop facilitated by Partner Connect.
- C . Create a table by uploading the file to cloud storage and then importing the data to Databricks.
- D . Create a table by manually copying and pasting the data values into cloud storage and then importing the data to Databricks.
A
Explanation:
Databricks provides a user-friendly interface that allows data analysts to quickly upload small datasets, such as a 50-row CSV file, and create tables within Databricks SQL.
The steps are as follows:
Access the Data Upload Interface:
In the Databricks workspace, navigate to the sidebar and click on New > Add or upload data.
Select Create or modify a table.
Upload the CSV File:
Click on the browse button or drag and drop the CSV file directly onto the designated area. The interface supports uploading up to 10 files simultaneously, with a total size limit of 2 GB.
Configure Table Settings:
After uploading, a preview of the data is displayed.
Specify the table name, select the appropriate schema, and configure any additional settings as needed.
Create the Table:
Once all configurations are set, click on the Create Table button to finalize the process.
This method is efficient for quickly importing small datasets without the need for additional tools or complex configurations. Options B, C, and D involve more complex or manual processes that are unnecessary for this task.
Reference: Create or modify a table using file upload
A data analyst runs the following command:
INSERT INTO stakeholders.suppliers TABLE stakeholders.new_suppliers;
What is the result of running this command?
- A . The suppliers table now contains both the data it had before the command was run and the data from the new suppliers table, and any duplicate data is deleted.
- B . The command fails because it is written incorrectly.
- C . The suppliers table now contains both the data it had before the command was run and the data from the new suppliers table, including any duplicate data.
- D . The suppliers table now contains the data from the new suppliers table, and the new suppliers table now contains the data from the suppliers table.
- E . The suppliers table now contains only the data from the new suppliers table.
B
Explanation:
The command INSERT INTO stakeholders.suppliers TABLE stakeholders.new_suppliers is not a valid syntax for inserting data into a table in Databricks SQL.
According to the documentation12, the correct syntax for inserting data into a table is either:
INSERT { OVERWRITE | INTO } [ TABLE ] table_name [ PARTITION clause ] [ ( column_name [, …] ) | BY NAME ] query
INSERT INTO [ TABLE ] table_name REPLACE WHERE predicate query
The command in the question is missing the OVERWRITE or INTO keyword, and the query part that specifies the source of the data to be inserted. The TABLE keyword is optional and can be omitted. The PARTITION clause and the column list are also optional and depend on the table schema and the data source. Therefore, the command in the question will fail with a syntax error.
Reference: INSERT | Databricks on AWS
INSERT – Azure Databricks – Databricks SQL | Microsoft Learn
A data analyst needs to share a Databricks SQL dashboard with stakeholders that are not permitted to have accounts in the Databricks deployment. The stakeholders need to be notified every time the dashboard is refreshed.
Which approach can the data analyst use to accomplish this task with minimal effort/
- A . By granting the stakeholders’ email addresses permissions to the dashboard
- B . By adding the stakeholders’ email addresses to the refresh schedule subscribers list
- C . By granting the stakeholders’ email addresses to the SQL Warehouse (formerly known as endpoint) subscribers list
- D . By downloading the dashboard as a PDF and emailing it to the stakeholders each time it is refreshed
B
Explanation:
To share a Databricks SQL dashboard with stakeholders who do not have accounts in the Databricks deployment and ensure they are notified upon each refresh, the data analyst can add the stakeholders’ email addresses to the dashboard’s refresh schedule subscribers list. This approach allows the stakeholders to receive email notifications containing the latest dashboard updates without requiring them to have direct access to the Databricks workspace. This method is efficient and minimizes effort, as it automates the notification process and ensures stakeholders remain informed of the most recent data insights.
Reference: Manage scheduled dashboard updates and subscriptions
How can a data analyst determine if query results were pulled from the cache?
- A . Go to the Query History tab and click on the text of the query. The slideout shows if the results came from the cache.
- B . Go to the Alerts tab and check the Cache Status alert.
- C . Go to the Queries tab and click on Cache Status. The status will be green if the results from the last run came from the cache.
- D . Go to the SQL Warehouse (formerly SQL Endpoints) tab and click on Cache. The Cache file will show the contents of the cache.
- E . Go to the Data tab and click Last Query. The details of the query will show if the results came from the cache.
A
Explanation:
Databricks SQL uses a query cache to store the results of queries that have been executed previously. This improves the performance and efficiency of repeated queries. To determine if a query result was pulled from the cache, you can go to the Query History tab in the Databricks SQL UI and click on the text of the query. A slideout will appear on the right side of the screen, showing the query details, including the cache status. If the result came from the cache, the cache status will show “Cached”. If the result did not come from the cache, the cache status will show “Not cached”. You can also see the cache hit ratio, which is the percentage of queries that were served from the cache.
Reference: The answer can be verified from Databricks SQL documentation which provides information on how to use the query cache and how to check the cache status. Reference link: Databricks SQL – Query Cache
What describes Partner Connect in Databricks?
- A . it allows for free use of Databricks partner tools through a common API.
- B . it allows multi-directional connection between Databricks and Databricks partners easier.
- C . It exposes connection information to third-party tools via Databricks partners.
- D . It is a feature that runs Databricks partner tools on a Databricks SQL Warehouse (formerly known as a SQL endpoint).
B
Explanation:
Databricks Partner Connect is designed to simplify and streamline the integration between Databricks and its technology partners. It provides a unified interface within the Databricks platform that facilitates the discovery and connection to a variety of data, analytics, and AI tools. By automating the configuration of necessary resources such as clusters, tokens, and connection files, Partner Connect enables seamless, bi-directional data flow between Databricks and partner solutions. This integration enhances the overall functionality of the Databricks Lakehouse by allowing users to easily incorporate external tools and services into their workflows, thereby expanding the platform’s capabilities and fostering a more cohesive data ecosystem. https://www.databricks.com/blog/2021/11/18/now-generally-available-introducing-databricks-partner-connect-to-discover-and-connect-popular-data-and-ai-tools-to-the-lakehouse?utm_source=chatgpt.com
Reference: Discover Databricks Partner Connect
A data team has been given a series of projects by a consultant that need to be implemented in the Databricks Lakehouse Platform.
Which of the following projects should be completed in Databricks SQL?
- A . Testing the quality of data as it is imported from a source
- B . Tracking usage of feature variables for machine learning projects
- C . Combining two data sources into a single, comprehensive dataset
- D . Segmenting customers into like groups using a clustering algorithm
- E . Automating complex notebook-based workflows with multiple tasks
C
Explanation:
Databricks SQL is a service that allows users to query data in the lakehouse using SQL and create visualizations and dashboards1. One of the common use cases for Databricks SQL is to combine data from different sources and formats into a single, comprehensive dataset that can be used for further analysis or reporting2. For example, a data analyst can use Databricks SQL to join data from a CSV file and a Parquet file, or from a Delta table and a JDBC table, and create a new table or view that contains the combined data3. This can help simplify the data management and governance, as well as improve the data quality and consistency.
Reference: Databricks SQL overview
Databricks SQL use cases
Joining data sources