
Practice Free CRM Analytics and Einstein Discovery Consultant Exam Online Questions
The CRM Analytics consultant at Cloud Kicks is asked to a dashboard displaying Opportunities data on the account’s record page. The dashboard should display only opportunity data related to the current account viewed.
How should the consultant accomplish this?
- A . Create the dashboard, insert in the account’s record page, and apply a filter based on the opportunity’s Id field.
- B . Create the dashboard, insert in the account’s record page, and apply a filter based on the account’s Id field.
- C . Create a dashboard, clone it and filter It for each account record, and embed them into the account’s record pages accordingly.
CRM Analytics uses permissions of the Integration User to extract data from Salesforce objects and
fields when a dataflow/recipe job runs.
Why should a consultant be cautious while syncing objects and fields containing sensitive data?
- A . The Integration User has Create and Modify All Data access.
- B . The Integration User has Modify All Data access.
- C . The Integration User has View All Data access.
A CRM Analytics consultant has prepared a CSV file to be uploaded to CRM Analytics. By mistake, one of the column headers is modified as random non-alphanumeric characters "*&**(&*(%", which went unnoticed prior to uploading the file.
What is the expected behavior of the uploaded CSV column?
- A . The column header is prefixed with "X" upon upload.
- B . The column header is auto-updated to “Column” + column number.
- C . The column header Is set to *&**(&*(%.
A
Explanation:
When uploading CSV files into CRM Analytics, column headers must follow certain formatting rules. Headers containing non-alphanumeric characters, such as "&**(&(%", will automatically be adjusted. Specifically, if the column header starts with non-alphanumeric characters or contains such characters, CRM Analytics will prefix the header with "X" to ensure compatibility with internal naming conventions. This behavior ensures that the column can be referenced in the platform without causing errors or conflicts.
Reference: You can find the CSV upload rules, including naming conventions and auto-formatting behaviors, outlined in the Salesforce CRM Analytics documentation provided during training, particularly under the module "Wave Analytics Explorer."
A CRM Analytics consultant has been asked to refactor a dashboard so that it loads quicker. After some analysis, the consultant found that most of the dashboard queries run in less than 5 seconds; however, the Opportunities Table takes more time to load when scrolled down from its initial view.
How should the consultant improve the performance of this dashboard?
- A . Create a second page on the dashboard and move the table to this new page.
- B . Create a second dashboard and move the table to this new dashboard.
- C . Create a Visualforce page and display a list view of the Opportunities on this new page.
A
Explanation:
In CRM Analytics, performance issues often arise when large tables or datasets are loaded on a single dashboard page, especially when the table contains a lot of data, as in the case of the Opportunities Table. One way to improve performance is to split the dashboard into multiple pages, moving resource-intensive components (like large tables) to a secondary page. By creating a second page and relocating the Opportunities Table, the initial dashboard page will load faster, and users can still access the table by navigating to the second page when needed. This practice ensures better overall performance and user experience.
Reference: CRM Analytics Dashboard Optimization
Universal Containers (UC) creates a dataset, "Book11", containing a budget per region per month for the first 6 months of the year, as shown in the graphic below. Now, UC wants to create a lens showing the total budget for each region for each month. Every combination of region and month must be shown in the lens, even if there is no data.
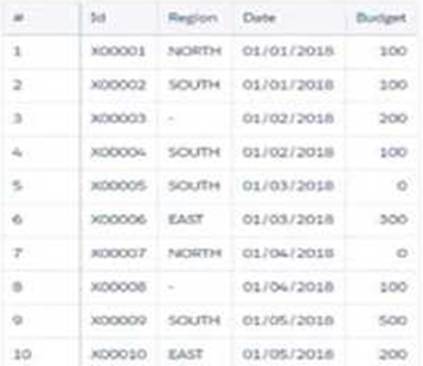
How should a CRM Analytics consultant help UC build this lens?
- A . Use a "fill" statement in SAQL query with a "partition" parameter.
- B . Use a “Compare Table" and add a column leveraging the “Running Total” function.
- C . Use a "Compare Table" and use the "Show Totals" option.
CRM Analytics users at Cloud Kicks are granted access to an app with specific dashboards.
When trying to download a specific widget, they are unable to do so.
- A . The users have access to the dashboard but not the dataset.
- B . The dashboard has been created for internal use and the users have a view only license.
- C . The permission set for the users is missing the download data permission.
C
Explanation:
In CRM Analytics, even if users are granted access to view an app and its dashboards, their ability to download data is controlled by permissions assigned via permission sets. Specifically, users need the "Download Data" permission to download data from widgets or dashboards. If this permission is missing from their permission set, they will be unable to download the specific widget, even though they can view the data.
Reference: The role of permission sets in granting access to data features, such as downloading data, is detailed in Salesforce’s CRM Analytics permissions documentation and is emphasized in the module "Building Lenses, Dashboards, and Apps in CRM Analytics."
Donut chart widget associated to the query "Query_pie_3" and grouped by the dimension "Type" The team wants any selection in the List widget to filter the Donut chart and vice versa. Users should be able to choose more than one Type (multi-selection).
What is the recommended way to accomplish the required filtering?
- A . Use "Connect Data Sources" to create a mapping of the two fields from the two datasets.
- B . Create a selection based Interaction and apply It to the query of "Query ple 3".
- C . Set up a result and selection based interaction for each query.
consultant is reviewing a model that is set to maximize the daily sales quantity of consumer products in stores, and they see this recommendation.
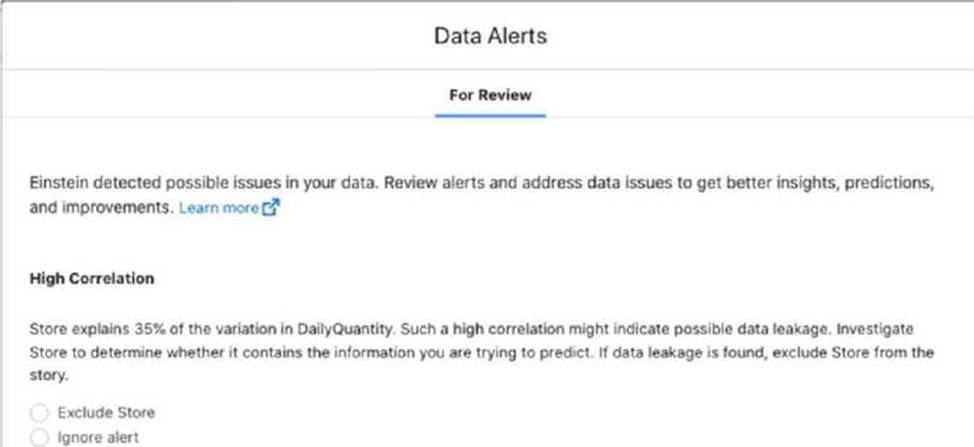
Which action should the consultant take?
- A . Verify client expectations that Store is a strong predictor for daily sales quantity.
- B . Remove the Store field from the model definition, because that is the recommended action.
- C . Ignore alert; the explanation of variation is only 35%, which is below 50%,
A
Explanation:
Upon reviewing the data model and noticing the high correlation alert between ‘Store’ and daily sales quantity, the appropriate action is to verify with the client their expectations regarding the influence of the Store field on daily sales. Here’s the rationale:
Understanding the Role of ‘Store’ in the Model: Before making any changes to the model, it’s crucial to understand whether the ‘Store’ field is expected to be a strong predictor based on the business context. If the client expects that different stores inherently have different sales volumes due to factors like location, size, or customer base, this correlation may be both meaningful and desired. Potential Data Leakage: High correlation warnings can sometimes indicate data leakage, where a predictor (like ‘Store’) might inadvertently include information about the outcome variable (daily sales quantity). It’s essential to verify whether this correlation makes sense logically or if it’s skewing the model predictions.
Client Consultation: Consulting with the client helps ensure that any modeling decisions align with their business knowledge and expectations. It’s about validating the model against real-world expectations and ensuring it remains a useful tool for decision-making.
By taking these steps, the consultant not only adheres to best practices in data science by validating model inputs and their implications but also ensures that the model aligns with the client’s business strategies and operational realities.
Cloud Kicks uses CRM Analytics for its sales reporting. A new manager needs access to CRM Analytics to see specific dashboards.
How should the system administrator give access to the Analytics Studio app in the App Launcher?
- A . Assign the CRM Analytics User permission set to the manager’s user.
- B . Share the Analytics Studio app to the user’s profile.
- C . Change the profile of the user to one that has access to the Analytics Studio.