
Practice Free Analytics-Con-301 Exam Online Questions
A client is concerned that a dashboard has experienced degraded performance after they added additional quick filters. The client asks a consultant to improve performance.
Which two actions should the consultant take to fulfill the client’s request? Choose two.
- A . Modify filters to include an "Apply" button.
- B . Add existing filters to Context.
- C . Ensure filters are set to display "Only Relevant Values" instead of "All Values in Database."
- D . Use Filter Actions instead of quick filters.
A,D
Explanation:
Comprehensive and Detailed Explanation From Exact Extract:
Quick filters are one of the most expensive features in Tableau because they require queries to populate value lists and dynamic recalculations when filters change.
According to Tableau performance documentation:
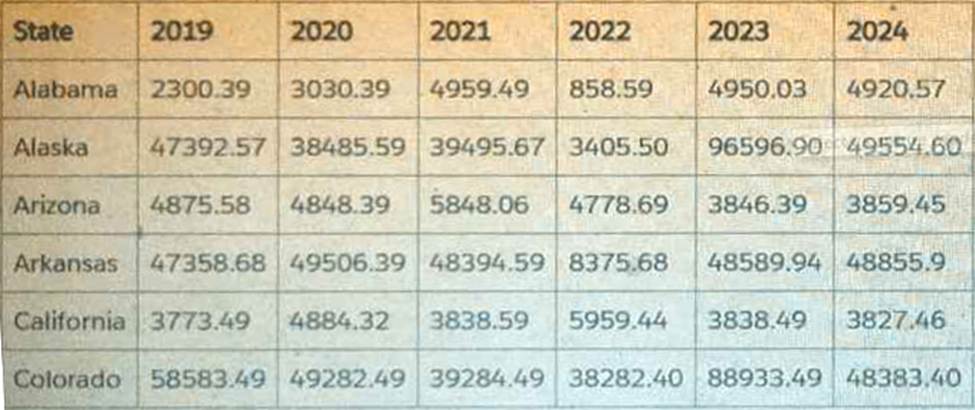
A Tableau consultant tasked with evaluating a data structure is handed the below sample dataset.
Which two statements are true about the dataset? Choose two.
- A . The data structure will require a lot of maintenance, as maintenance will need to be done to handle a new column for a new year.
- B . The names of the columns are accurate and indicate what the data values actually mean.
- C . The data can be pivoted in order to enable a year selector.
- D . The data needs to be denormalized before it can be used.
A,C
Explanation:
The dataset shown is a classic “wide” format”:
A single row per state
Separate columns for each year: 2019, 2020, 2021, 2022, 2023, 2024
Tableau’s documentation on data structure and pivoting explains:
✔ Why A is TRUE
Tableau documentation identifies wide datasets (multiple columns representing categories such as years, months, or similar time periods) as high-maintenance structures because: For every new year, a new column must be added.
Metadata and calculations must be updated each time.
This type of structure is described as having poor scalability and higher maintenance.
This dataset fits that exact description, so A is correct.
✔ Why C is TRUE
According to Tableau’s “Pivot Data from Columns to Rows” section:
Wide datasets can and should often be pivoted so that repeated columns (such as year columns) become rows.
Pivoting enables dynamic capabilities such as:
Year filters (year selector)
Time-series analysis
Consistent aggregations
Simplified calculations
Pivoting this dataset would produce:
State
Year
Value
Alabama
2019
A client wants guidance for Creators to build efficient extracts from large data sources.
What are three Tableau best practices that the Creators should use? Choose three.
- A . Keep only the data required for analysis by using extract filters.
- B . Use aggregate data for visible dimensions, whenever possible.
- C . Use only live connections as they are always faster than extracts.
- D . Include all the data from the original data source in the extract.
- E . Hide all unused fields.
A,B,E
Explanation:
To build efficient extracts from large data sources, it is crucial to minimize the load and optimize the performance of the extracts:
A customer wants to leverage generative AI capabilities. The customer is currently on Tableau Server 2023.1.
How is the customer able to leverage generative AI in Tableau?
- A . Upgrade Tableau Server from 2023.1 to the latest version.
- B . Migrate Tableau Server to Tableau Cloud.
- C . Use a dashboard accelerator from Tableau Exchange.
- D . Perform API calls from Tableau Server to sandboxed extensions hosted by Tableau.
B
Explanation:
Comprehensive and Detailed Explanation From Exact Extract:
Tableau’s official generative AI capability―Tableau Pulse and Einstein-powered Tableau AI features― are available only on Tableau Cloud, not Tableau Server. Key Tableau facts:
Tableau Server (any version, including new ones) does not provide generative AI capabilities.
Tableau Cloud includes AI features such as:
Tableau Pulse
Einstein Copilot
Natural language questions
Automated insights
Upgrading Tableau Server does not provide generative AI.
Extensions and accelerators do not enable AI functionality.
Therefore, the customer must migrate from Tableau Server to Tableau Cloud to leverage generative AI.
Tableau AI/Pulse documentation stating availability only in Tableau Cloud.
Feature comparison charts showing generative AI unavailable on Tableau Server.
A client uses Tableau Data Management and notices that when they view a data source, they sometimes see a different count of workbooks in the Connected Workbooks tab compared to the lineage count in Tableau Catalog.
What is the cause of this discrepancy?
- A . Some workbooks have been connected to the data source, but do not use any fields from it.
- B . Some workbooks have not been viewed by enough users yet.
- C . Some of the workbooks connected to the data source are not visible to the user due to permissions.
- D . Some Creators have connected to the data source in Tableau Desktop but have not yet published a workbook.
C
Explanation:
The discrepancy between the count of workbooks in the Connected Workbooks tab and the lineage count in Tableau Catalog can occur because of user permissions. In Tableau Data Management, the visibility of connected workbooks is subject to the permissions set by administrators. If a user does not have permission to view certain workbooks, they will not see them listed in the Connected Workbooks tab, even though these workbooks are part of the data source’s lineage and are counted in Tableau Catalog.
Reference: This explanation is based on the functionality of Tableau Data Management and Tableau Catalog, which includes managing user permissions and access to workbooks. The information is supported by Tableau’s official documentation on data management and security practices1.
A consultant used Tableau Data Catalog to determine which workbooks will be affected by a field change.
Catalog shows:
Published Data Source → 7 connected workbooks
Field search (Lineage tab) → 6 impacted workbooks
The client asks: Why 7 connected, but only 6 impacted?
- A . The field is used twice in a single workbook.
- B . The consultant lacked sufficient permissions to see the seventh workbook.
- C . The field being altered is not used in the seventh workbook.
- D . The seventh workbook is connected via Custom SQL so it didn’t appear in the list.
C
Explanation:
Comprehensive and Detailed Explanation From Exact Extract:
Key Tableau Catalog behaviors:
Connected workbooks = any workbook linked to the published data source.
Impacted workbooks = only workbooks that use the specific field.
If a workbook connects to the data source but never uses the field, it appears as “connected” but not impacted.
This explains EXACTLY why:
7 workbooks are connected
Only 6 use the changed field
Therefore only 6 are impacted
This matches Option C.
Why the other options are incorrect:
A client wants to report Saturday and Sunday regardless of the workbook’s data source’s locale settings.
Which calculation should the consultant recommend?
- A . DATEPART(‘weekday’, [Order Date])>=6
- B . DATEPART(‘iso-weekday’, [Order Date])>=6
- C . DATENAME(‘iso-weekday’, [Order Date])>=6
- D . DATEPART(‘iso-weekday’, [Order Date])=1 or DATEPART(‘iso-weekday’, [Order Date])=7
D
Explanation:
The calculation DATEPART(‘iso-weekday’, [Order Date])=1 or DATEPART(‘iso-weekday’, [Order Date])=7 is recommended because the ISO standard considers Monday as the first day of the week (1) and Sunday as the last day (7). This calculation will correctly identify Saturdays and Sundays regardless of the locale settings of the workbook’s data source, ensuring that the report includes these days as specified by the client.
Reference: The use of the ‘iso-weekday’ part in the DATEPART function is consistent with the ISO 8601 standard, which is independent of locale settings. This approach is supported by Tableau’s documentation on date functions and their behavior with different locale settings123.
To accurately identify weekends across different locale settings, using the ‘iso-weekday’ component is reliable as it is consistent across various locales:
ISO Weekday Function: The ISO standard treats Monday as the first day of the week (1), which makes Sunday the seventh day (7). This standardization helps avoid discrepancies in weekday calculations that might arise due to locale-specific settings.
Identifying Weekends: The calculation checks if the ‘iso-weekday’ part of the date is either 1 (Sunday) or 7 (Saturday), thereby correctly identifying weekends regardless of the locale settings.
Reference: Handling Locale-Specific Settings: Using ISO standards in date functions allows for uniform results across systems with differing locale settings, essential for consistent reporting in global applications.
A consultant is tasked with improving the performance of a large workbook that contains multiple dashboards, each of which leverages a separate data source.
What is one way to improve performance?
- A . Convert Data Source filters to Quick Filters.
- B . Convert any extracted data sources to live data sources.
- C . Restrict the users who can access the workbook.
- D . Split the workbook into multiple workbooks.
D
Explanation:
Comprehensive and Detailed Explanation From Exact Extract:
Tableau’s performance best-practice documentation explains that large workbooks containing many dashboards, multiple data sources, and complex interactions have heavier memory and CPU requirements. When a workbook grows too large, Tableau must: Load every data source Cache metadata for all sheets
Maintain connections across all dashboards
Render more worksheets simultaneously
This increases workbook load time and slows dashboard performance.
A documented method for improving performance is to split a large workbook into multiple smaller workbooks, each containing only the dashboards relevant to a particular audience or subject area. Smaller workbooks:
Reduce the amount of metadata Tableau must load
Reduce extract sizes per workbook
Improve caching efficiency
Improve dashboard loading and rendering time
Options A, B, and C do not improve workbook performance:
A client has a database that stores widget inventory by day and it is updated on a nonstandard schedule as shown below.
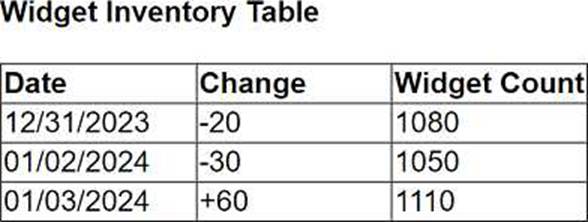
They want a data visualization that shows widget inventory daily, however their business unit does not have the ability to modify the data warehouse structure.
What should the client do to achieve the desired result?
- A . Create a temporary table in the database.
- B . Use Tableau Desktop to visualize null values.
- C . Update the Widget Inventory Table to be a daily snapshot.
- D . Use Tableau Prep to add new rows.
D
Explanation:
For a client who needs a daily visualization of widget inventory but cannot modify the data warehouse structure, the best approach is to use Tableau Prep to add new rows. Tableau Prep can be used to manipulate the existing dataset by adding missing date entries and appropriately adjusting inventory counts based on available data. This allows the creation of a complete daily snapshot for visualization without needing changes to the underlying database structure.
A consultant wants to improve the performance of reports by moving calculations to the data layer and materializing them in the extract.
Which type of calculation is the consultant able to move?
- A . A row-level calculation
- B . A calculation that contains table calculation functions
- C . A calculation that contains parameters
- D . A calculation that contains an aggregation
A
Explanation:
Comprehensive and Detailed Explanation From Exact Extract:
Tableau allows certain calculations to be materialized in extracts, meaning they are precomputed and stored inside the .hyper file to improve performance.
According to Tableau’s extract documentation:
Materializable calculations must be compatible with the extract engine and must not depend on dynamic, view-based, or post-query logic.
Only row-level calculations and aggregation-level calculations without dependencies on runtime context can be materialized.
Tableau cannot materialize any calculation containing:
Table calculation functions
Functions requiring post-aggregation logic
View-dependent elements
Parameters that need runtime evaluation
Evaluation of the choices: