
Practice Free Analytics-Con-301 Exam Online Questions
A business analyst is creating a view of the top 10 customers for each region. The analyst has set a "Top 10" filter on Customer Name.
However, it did not display the top 10 customers per region, as shown in the image below.
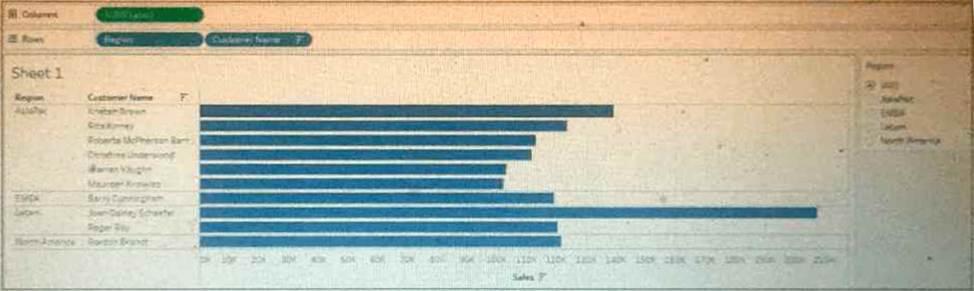
Which type of filter should the business analyst add to filter for region?
- A . Extract filter
- B . Dimension filter
- C . Table Calculation filter
- D . Context filter
D
Explanation:
The issue occurs because of Tableau’s Order of Operations.
Key Tableau logic:
Top N filters are a type of Dimension filter.
Dimension filters are evaluated after Context filters.
When you place Region on Filters (as a standard dimension filter), Tableau:
First applies the Customer Name Top 10 filter across the entire data set, not per region.
Then limits the view to the selected region(s).
This results in seeing the global Top 10 customers, not the Top 10 per region.
How to fix it:
To force Tableau to compute Top 10 customers within each region, the Region filter must be applied before the Top N Customer filter.
This is done by making Region a Context Filter.
Effect of a Context Filter:
Context filters are executed before the Top N filter.
Region becomes the context.
Tableau then evaluates the Top 10 customers inside each region’s subset of data.
This produces the correct “Top 10 customers per region”.
Why the other options are incorrect:
A customer migrated from Tableau Server to Tableau Cloud. However, there is still private network data behind the corporate firewall that Tableau Cloud needs to access securely.
Which data connection strategy should a Tableau consultant advise with minimal software maintenance by the customer?
- A . Tableau Bridge
- B . Private Connect
- C . Direct Connect
- D . Data Connect
D
Explanation:
Comprehensive and Detailed Explanation From Exact Extract:
The question focuses on two key requirements:
Tableau Cloud must access private network data behind a corporate firewall.
The customer wants minimal software maintenance.
To determine the correct answer, each option must be evaluated based on Tableau’s official documented behavior.
Why Option A (Tableau Bridge) Is Not the Best Answer
Tableau Bridge is described in Tableau documentation as a self-managed solution used to connect
Tableau Cloud to private network/on-premises data.
Key characteristics of Bridge include:
It is installed and maintained by the customer on a machine behind the firewall.
It requires ongoing updates, monitoring, and administration by the customer.
Because the question specifically asks for minimal software maintenance, Bridge does not meet the requirement.
Why Option B (Private Connect) Is Not the Best Answer
Private Connect is a feature allowing Tableau Cloud to connect privately and securely to AWS-hosted
cloud data sources using private networking.
However:
It is primarily intended for AWS-based data services (such as Snowflake on AWS, Amazon Redshift, Athena).
The question describes private network data behind a corporate firewall, which usually refers to on-premises data, not cloud-hosted AWS services.
Therefore, Private Connect is not the generally applicable solution for the scenario described.
Why Option C (Direct Connect) Is Incorrect
“Direct Connect” is not an official Tableau Cloud feature for connecting to private network data.
This option can be eliminated immediately.
Why Option D (Data Connect) Is the Correct Answer
Tableau’s Data Connect service is documented as:
A solution that provides secure access to private network or on-premises data, similar in purpose to Bridge.
A remotely managed, monitored, and streamlined solution where Tableau manages the underlying Kubernetes cluster.
A service that reduces administrative overhead for the customer by allowing Tableau to handle cluster management, monitoring, and maintenance. Tableau documentation clearly states:
Data Connect provides access to private network data similar to Bridge.
But unlike Bridge, it is designed to reduce the overhead of administration because Tableau remotely manages and maintains the cluster used to provide connectivity.
It follows a shared responsibility model where the customer provides compute resources, and Tableau manages the software layer―including maintenance and monitoring. This directly satisfies the scenario’s requirement:
“Minimal software maintenance by the customer.”
Thus, among the options provided, Data Connect is the correct and most appropriate answer.
Reference From Tableau Consultant / Study Materials
Tableau documentation describing Tableau Bridge as a self-managed proxy client installed behind the firewall.
Tableau documentation describing Data Connect as a remotely managed, monitored, and streamlined solution for accessing private network data.
Tableau documentation explaining the shared responsibility model for Data Connect, where Tableau handles cluster management and reduces the customer’s administrative overhead.
Tableau materials comparing Bridge vs. Data Connect, stating that Data Connect reduces administration and enables more scalable private network connectivity.
Tableau information noting that Private Connect is designed for AWS-hosted cloud data, not general private network on-premises data.
A client wants to count all the distinct orders placed in 2010. They have written the following calculation, but the result is incorrect.
IF YEAR([Date])=2010 THEN COUNTD ([OrderID]) END
Which calculation will produce the correct result?
- A . IF MIN(YEAR([Date]))=2010 THEN WINDOW_COUNTD([OrderID]) END
- B . IF YEAR([Date])=2010 THEN {COUNTD ([OrderID])} END
- C . COUNTD(IF YEAR([Date])=2010 THEN [OrderID] END)
- D . COUNT(IF YEAR([Date])=2010 THEN [OrderID] END)
C
Explanation:
The correct calculation to count all distinct orders placed in 2010 involves placing the conditional inside the aggregation function, not the other way around.
Here’s how to correct the client’s calculation:
Original Calculation Issue: The client’s original calculation attempts to apply the COUNTD function within an IF statement, which does not work as expected because the COUNTD function cannot conditionally count within the scope of the IF statement.
Correct Calculation: COUNTD(IF YEAR([Date]) = 2010 THEN [OrderID] END). This calculation checks each order date; if the year is 2010, it returns the OrderID. The COUNTD function then counts all unique OrderIDs that meet this condition.
Why It Works: This method ensures that each order is first checked for the year condition before being counted, effectively filtering and counting in one step. It efficiently processes the data by focusing the distinct count operation only on relevant records. Reference
This approach is consistent with Tableau’s guidance on using conditional logic inside aggregation functions for accurate and efficient data calculations, as detailed in the Tableau User Guide under "Aggregations and Calculations".
Which technique should a Tableau consultant use to make visualizations faster?
- A . Use Show Relevant Values on any filters.
- B . Remove any unneeded dimensions from the Detail shelf.
- C . Use COUNTD to aggregate data as much as possible.
- D . Include more sheets to increase rendering speed.
B
Explanation:
Comprehensive and Detailed Explanation From Exact Extract:
Tableau performance documentation explains that rendering speed is strongly affected by the number of marks that Tableau must draw. Each dimension placed on the Detail shelf increases the granularity of the view and increases the number of marks in the visualization.
Removing unnecessary dimensions:
Reduces the number of marks
Reduces rendering time
Decreases memory and CPU usage
Improves interactive performance
Option A (Show Relevant Values) can slow performance because Tableau must dynamically calculate relevancy each time filters change.
Option C is incorrect because COUNTD is one of the slowest aggregate functions in Tableau and does not speed visualization.
Option D is incorrect because adding more sheets increases dashboard load time and rendering workload.
Removing unnecessary fields from Detail is a documented best practice for improving visualization speed.
Tableau Performance Checklist recommending reducing marks and removing unnecessary dimensions.
Rendering optimization guidance explaining how dimensions on Detail expand mark counts.
Best practices discouraging overuse of COUNTD.
Which technique should a Tableau consultant use to optimize workbook performance with a live data source?
- A . Use numbers and Booleans instead of strings and dates.
- B . Use larger sets of more granular records in Table Calculations instead of smaller sets of aggregated records.
- C . Use Custom SQL for Tableau query optimization.
- D . Use Compute Calculations Now for live data sources to materialize calculations.
A
Explanation:
Comprehensive and Detailed Explanation From Exact Extract:
When optimizing performance with live connections, Tableau documentation emphasizes minimizing the workload passed to the database. Key principles include:
Databases resolve numeric and Boolean fields significantly faster than strings and dates.
Using simpler data types reduces query parsing time and improves join and filter performance.
This is a standard Tableau recommendation for live query optimization.
Why the other answers are incorrect:
B: Table calculations add workload on Tableau, but live performance depends on database efficiency; granular table calc processing worsens performance.
C: Custom SQL often hurts performance because it disables query optimization, increases load times, and prevents Tableau from generating efficient queries.
D: Compute Calculations Now applies only to extracts, and has no effect on live connections.
Thus, the documented performance best practice for live sources is to use numbers and Booleans instead of strings and dates.
Live connection optimization guidance: prefer numeric and Boolean fields over strings/dates.
Best practices cautioning against Custom SQL for performance.
Documentation stating Compute Calculations Now applies only to extracts.
A consultant builds a report where profit margin is calculated as SUM([Profit]) / SUM([Sales]). Three groups of users are organized on Tableau Server with the following levels of data access that they can be granted.
. Group 1: Viewers who cannot see any information on profitability
. Group 2: Viewers who can see profit and profit margin
. Group 3: Viewers who can see profit margin but not the value of profit
Which approach should the consultant use to provide the required level of access?
- A . Use user filters to access data on profitability to all groups. Then, create a calculated field that allows visibility of profit value to Group 2 anduse the calculation in the view in the report.
- B . Specify in the row-level security (RLS) entitlement table individuals who can see profit, profit margin, or none of these. Then, use the tabledata to create user filters in the report.
- C . Use user filters to allow only Groups 2 and 3 access to data on profitability. Then, create a calculated field that limits visibility of profit value toGroup 2 and use the calculation in the view in the report.
- D . Specify with user filters in each view individuals who can see profit, profit margin, or none of these.
C
Explanation:
The approach of using user filters to control access to data on profitability for Groups 2 and 3, combined with a calculated field that restricts the visibility of profit value to only Group 2, aligns with Tableau’s best practices for managing content permissions. This method ensures that each group sees only the data they are permitted to view, with Group 1 not seeing any profitability information, Group 2 seeing both profit and profit margin, and Group 3 seeing only the profit margin without the actual profit values. This setup can be achieved through Tableau Server’s permission capabilities, which allow for detailed control over what each user or group can see and interact with12.
Reference: The solution is based on the capabilities and permission rules that are part of Tableau Server’s security model, as detailed in the official Tableau documentation12. These resources provide guidance on how to set up user filters and calculated fields to manage data access levels effectively.
A client has a sales dataset that contains fields named Customer ID, Region, Item, and Sales Amount.
Each row represents a single sale. There may be multiple sales for each Customer ID.
The client wants to visualize the average total customer sales by region.
Which Level of Detail (LOD) expression should a consultant recommend?
- A . AVG({EXCLUDE [Region]: SUM([Sales Amount])})
- B . {FIXED [Region]: AVG([Sales Amount])}
- C . AVG({FIXED [Customer ID], [Region]: SUM([Sales Amount])})
- D . {FIXED [Customer ID], [Region]: AVG([Sales Amount])}
C
Explanation:
Comprehensive and Detailed Explanation From Exact Extract:
The requirement is:
Compute total sales per customer, not per transaction.
Then compute the average of those customer totals, grouped by region.
Tableau documentation states that FIXED LOD expressions are used to calculate values at a specific
level of granularity regardless of the view.
To solve the business need:
Step 1:
Calculate total customer sales for each Customer ID within each Region:
{ FIXED [Customer ID], [Region]: SUM([Sales Amount]) } This produces one number per customer per region. Step 2:
Compute the average of those totals:
AVG( { FIXED [Customer ID], [Region]: SUM([Sales Amount]) } ) This yields:
Average total customer sales by region This is exactly option C.
Why the other options are incorrect:
A client has a pipeline dashboard that takes a long time to load. The dashboard is connected to only one large data source that is an extract.
It contains two calculated fields:
. TOTAL([Opportunities])
・ SUM([Value])
It also contains two filters:
. A Relative Date filter on Created Date, a Date field containing values from 5 years ago until today
. A Multiple Values (Dropdown) filter on Account Name, a String field containing 1,000 distinct values
A consultant creates a Performance Recording to troubleshoot the issue, and finds out that the longest-running event is "Executing Query."
Which step should the consultant take to resolve this issue?
- A . Replace the Multiple Values (Dropdown) filter with a Multiple Values (Custom List) filter.
- B . Replace the Relative Date filter with a Multiple Values (Dropdown) filter on YEAR([Created Date]).
- C . Replace the TOTAL([Opportunities]) calculation with a Grand Total.
- D . Replace SUM([Value]) with WINDOW_SUM([Value]).
B
Explanation:
To improve the loading time of the pipeline dashboard, which primarily suffers from long query execution times due to a comprehensive Relative Date filter:
Relative Date Filter Issue: The existing Relative Date filter on "Created Date" covers a broad range (5 years), leading to significant data processing overhead as it includes granular date calculations over a large dataset.
Optimized Approach: By replacing the Relative Date filter with a Multiple Values (Dropdown) filter
based on YEAR([Created Date]), the filter granularity is reduced. Filtering by year simplifies the query
by limiting the volume of data processed and reducing the complexity of the filter condition.
Implementation Benefit: This approach still provides the flexibility to view data across different years
but does so by reducing the load on the database during query execution, which is critical for
improving the performance of the dashboard.
Reference
This recommendation aligns with Tableau performance optimization strategies, specifically regarding the management of date filters to minimize their impact on query load, as discussed in Tableau performance tuning sessions and guides.