
Practice Free 300-445 Exam Online Questions
The network team has deployed Webex RoomOS Endpoint Agents and integrated Webex Control Hub with Thousand Eyes. The VoIP team wants to know which metrics they can collect from the Webex Control Hub view.
Where does the VoIP team find the network data?
- A . Devices
- B . Network Path
- C . Users
- D . Settings
B
Explanation:
According to the Designing and Implementing Enterprise Network Assurance (300-445 ENNA) curriculum, the integration between Thousand Eyes and Webex Control Hub provides a streamlined troubleshooting experience for collaboration services. For the VoIP team to access the specific Thousand Eyes network telemetry―such as latency, loss, and jitter―they must navigate to the Network Path (Option B) section within the Troubleshooting tab of the Control Hub.15
The Network Path visualization is a direct result of the Thousand Eyes Endpoint Agent data being pulled into the Webex interface.16 When a user or RoomOS device experiences poor audio or video quality during a meeting, the Control Hub’s troubleshooting view displays a "Network Path" line under the participant’s details.17 By clicking on this line, the VoIP team can see a hop-by-hop breakdown of the entire route from the collaboration device to the Webex media node. This view highlights specific hops where performance is "Poor" (red), "Fair" (yellow), or "Good" (green) based on predefined thresholds for latency (>400ms) or loss (>5%).
While "Devices" (Option A) is where the agents are activated, and "Users" (Option C) allows for selecting a specific participant, the actual telemetry metrics and the visualization of the network route are strictly located in the Network Path view. This integration eliminates the need for the VoIP team to leave the Webex environment for initial triage, as they can identify if a problem is local to the branch office or deep within a service provider’s network directly from the "Network Path" dashboard.
A network engineer deploys a Thousand Eyes Docker agent on a switch using app-hosting. The agent needs to communicate through a proxy server, but this configuration was missed during the initial deployment. The engineer adds the proxy settings to the app-hosting configuration.
What is the next step to ensure the agent uses the proxy and appears online in the Thousand Eyes portal?
- A . Restart the container using app-hosting stop appid agentname followed by app-hosting start appid agentname
- B . Reinstall the agent using the app-hosting install command with the correct proxy settings
- C . Execute the full agent lifecycle: app-hosting stop appid agentname, app-hosting deactivate appid agentname, app-hosting activate appid agentname, app-hosting start appid agentname
- D . No action required; the agent will pick up the configuration automatically
C
Explanation:
In the Designing and Implementing Enterprise Network Assurance (300-445 ENNA) implementation guide, the Cisco IOS XE Application Hosting lifecycle is a critical concept for troubleshooting and configuration management. When an application environment variable―such as proxy settings―is modified in the app-hosting configuration, a simple restart of the container is insufficient.
The correct procedure involves moving the application back to the Configured state before bringing it back to Running. This requires a four-step lifecycle execution (Option C):
Stop: Terminates the current running instance of the container.
Deactivate: Releases the hardware resources (CPU, Memory, Virtual Interfaces) and, crucially, detaches the previous runtime configuration.
Activate: Re-allocates the resources and injects the new configuration parameters (including the updated proxy settings) into the container’s environment.
Start: Initiates the container with the newly applied configuration.
Without the deactivate/activate sequence, the container will continue to use the environment variables present at the time of its initial activation, causing the agent to remain offline as it fails to reach the Thousand Eyes portal without the proxy. Reinstalling (Option B) is an unnecessary and time-consuming step that involves re-downloading or re-copying the image, while No action (Option D) will result in no change to the agent’s connectivity status.
What is the primary purpose of integrating Thousand Eyes with Meraki?
- A . To deploy Endpoint Agents for VPN connectivity monitoring
- B . To monitor external applications and services from SD-WAN sites
- C . To enhance cloud security and compliance
- D . To manage user access policies and permissions
B
Explanation:
The Designing and Implementing Enterprise Network Assurance (300-445 ENNA) framework highlights the integration between Thousand Eyes and Cisco Meraki as a solution for "cross-domain assurance".5 The primary purpose of this integration is to monitor external applications and services from SD-WAN sites (Option B).
In a distributed Meraki environment, IT teams often struggle with visibility into the "Internet as a WAN," where performance issues may occur outside the local network perimeter. By embedding Thousand Eyes Enterprise Agents natively within Meraki MX appliances, organizations can bridge the gap between internal LAN metrics and external service health.6 This integration allows for proactive monitoring of SaaS platforms (like Microsoft 365, Salesforce, and Webex) and other public-facing dependencies using synthetic probes. It complements the native Meraki Insight (MI), which provides passive monitoring of real user traffic, by adding active path visualization and hop-by-hop analysis across the Internet.
Key advantages of this integration include:
One-Click Activation: Enabling the Thousand Eyes agent directly from the Meraki Dashboard without additional hardware.7
Pre-configured Templates: Using built-in test templates for common SaaS applications to accelerate troubleshooting.8
Isolation of Fault Domains: Quickly determining if a user’s lag is caused by a local Wi-Fi issue (via Meraki wireless metrics) or an ISP routing problem (via Thousand Eyes path data).9
While Thousand Eyes does provide visibility for VPN and security, Options A, C, and D are not the primary focus of the specific Meraki-Thousand Eyes integration architecture, which is centered on extending application performance assurance to distributed branch locations.
Your organization wants to be notified of an event as soon as it is triggered by an alert threshold. This notification should be sent to your ITSM and generate an incident so it can be responded to appropriately.
What kind of integration should you use?
- A . ServiceNow Integration
- B . DNA Center Integration
- C . Custom Webhooks
- D . Alerts API
A
Explanation:
In the Designing and Implementing Enterprise Network Assurance (300-445 ENNA) curriculum, the
objective of modern network assurance is to bridge the gap between "visibility" and "action". When an organization requires an automated workflow to handle network performance anomalies, the most efficient architecture is the native ServiceNow Integration (Option A). This integration is categorized as a "Custom-Built" or native integration within the Thousand Eyes platform, designed specifically to facilitate the delivery of direct notifications into a ServiceNow account.
According to the ENNA implementation standards, the Thousand Eyes ServiceNow integration utilizes the ServiceNow Incident Management module. When a predefined alert rule (such as a 5% packet loss threshold on a critical SaaS path) is violated, Thousand Eyes triggers an event and immediately pushes the alert data to ServiceNow via an OAuth-authenticated connection. Within ServiceNow, this data is used to automatically generate an Incident, complete with relevant metadata such as the test name, agent location, and the specific metrics that triggered the violation. This automation eliminates the manual overhead of "copy-pasting" alert details from a monitoring dashboard into a ticketing system, thereby significantly reducing the Mean Time to Identification (MTTI).
While Custom Webhooks (Option C) can achieve a similar result by sending JSON payloads to a REST API, they require additional development effort to parse the data on the receiver side. The native ServiceNow integration provides a pre-configured template that maps Thousand Eyes alert fields directly to ServiceNow incident fields, offering a "one-click" setup experience that is preferred for enterprise-grade deployments. Options B and D are irrelevant for the specific goal of ITSM incident generation. Therefore, for direct ITSM notification and incident creation, the native ServiceNow Integration is the verified recommendation.
Refer to the exhibit.
An engineer is tasked with configuring a new test to monitor a web application from the employee’s point of view.
What two actions should be taken to fulfill the requirement?
- A . Create a new custom application monitor
- B . Create a new google suite monitor
- C . Add a new scheduled test to the monitor
- D . Add a new dynamic test to the monitor
- E . Add a new test template
A, C
Explanation:
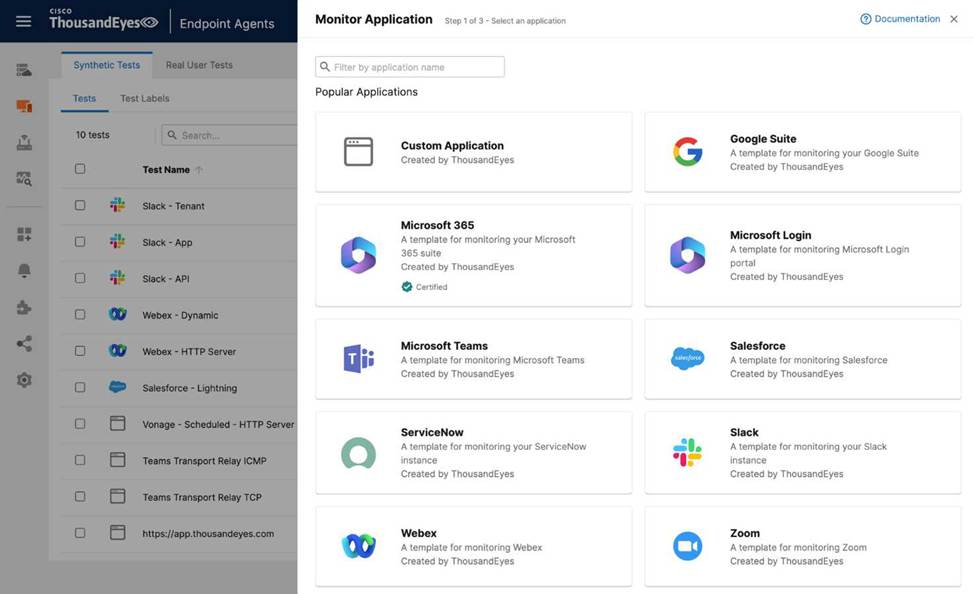
In the Designing and Implementing Enterprise Network Assurance (300-445 ENNA) curriculum, monitoring the digital experience of internal employees requires leveraging Thousand Eyes Endpoint Agents to simulate or record traffic from the user’s specific vantage point. When an engineer needs to monitor a specific, potentially internal or non-standard web application, they must utilize the Custom Application workflow within the Endpoint Experience settings.
According to the ENNA implementation standards, the first necessary action is to Create a new custom application monitor (Option A). In the Thousand Eyes portal under Endpoint Experience > Test Settings > Synthetic Tests, the "Monitor Application" button provides access to pre-defined templates for popular services like Microsoft 365 or Webex. However, for a unique enterprise application, the engineer must select "Custom Application" to define the application’s identity, including its name and the relevant domain or URL.
The second required action is to Add a new scheduled test to the monitor (Option C). Endpoint Agents perform Scheduled Tests at regular, predefined intervals―such as every 5 or 10 minutes―to proactively check the application’s availability, response time, and network path health without requiring user interaction. By adding a scheduled HTTP Server or Network test to the custom monitor, the engineer ensures a consistent baseline of the application’s performance as seen from the employee’s machine.
Reviewing the incorrect options:
Google Suite monitor (Option B): This is a specific template for Google Workspace and is not suitable for a custom application.
Dynamic Tests (Option D): These are specifically designed for collaboration tools like Zoom or Microsoft Teams to capture ad-hoc sessions; they are generally not used for baselining a standard custom web application.
Test Template (Option E): While all monitors are based on templates, "adding a new template" is not a configuration action but rather a result of the monitoring setup.
Refer to the exhibit.
An engineer must use Cisco Thousand Eyes testing to monitor their Cisco Catalyst SD-WAN fabric.
Which SD-WAN component is being monitored by Thousand Eyes?
- A . underlay
- B . IPsec tunnels
- C . overlay
- D . GRE tunnels
A
Explanation:
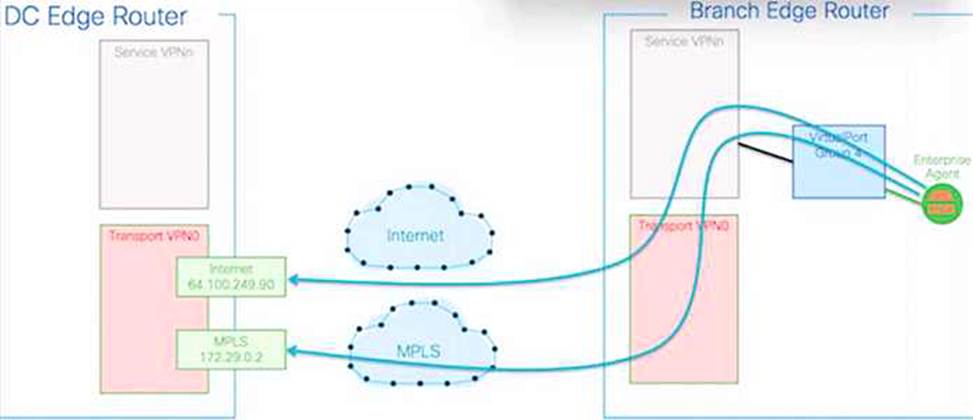
In the Designing and Implementing Enterprise Network Assurance (300-445 ENNA) curriculum, understanding the visibility gap between the SD-WAN overlay and the transport underlay is a core competency. The provided exhibit illustrates a Thousand Eyes Enterprise Agent deployed on a Branch Edge Router performing tests across two distinct paths: Internet (reaching a destination at 64.100.249.90) and MPLS (reaching a destination at 172.29.0.2).
According to the ENNA architecture guidelines, Thousand Eyes is primarily utilized to provide hop-by-hop visibility into the underlay network. While SD-WAN controllers like vManage provide native monitoring for the overlay―the logical IPsec tunnels (Option B) that form the SD-WAN fabric―they often lack granular visibility into the physical service provider paths (the underlay) that carry those tunnels. The exhibit specifically highlights the agent probing the transport networks (Transport VPN0) directly, bypassing the overlay tunnels to measure the raw performance of the ISP and MPLS circuits.
By monitoring the underlay (Option A), the engineer can identify if high latency or packet loss is caused by a specific hop within the service provider’s infrastructure or at a peering point. This "underlay visibility" is critical for troubleshooting SD-WAN performance issues where the overlay may report a tunnel down, but the root cause lies in a BGP routing change or physical fiber cut in the provider network. Thousand Eyes Enterprise Agents, natively integrated into Catalyst 8000 and ISR 4000 platforms, allow for this persistent underlay monitoring without additional hardware.
Overlay (Option C): While Thousand Eyes can monitor overlay performance, the exhibit’s focus on the raw IP addresses (Internet and MPLS) in the transport VPN indicates an underlay test.
IPsec/GRE Tunnels (Options B & D): These represent the transport mechanisms of the overlay. Thousand Eyes probes the path under these tunnels to ensure the transport health is sufficient to support the fabric.
Carefully review the exhibits.
Which detail indicates the network issue might be caused by a BGP Hijack?
- A . Availability Drop
- B . AS 16509 change to AS 10297
- C . HTTP Server response delay
- D . Packet Loss
B
Explanation:
In the Designing and Implementing Enterprise Network Assurance (300-445 ENNA) curriculum, identifying routing anomalies such as BGP Hijacking is a critical aspect of external network assurance. A BGP Hijack occurs when an Autonomous System (AS) illegitimately announces a prefix it does not own, causing traffic intended for the rightful owner to be misdirected.
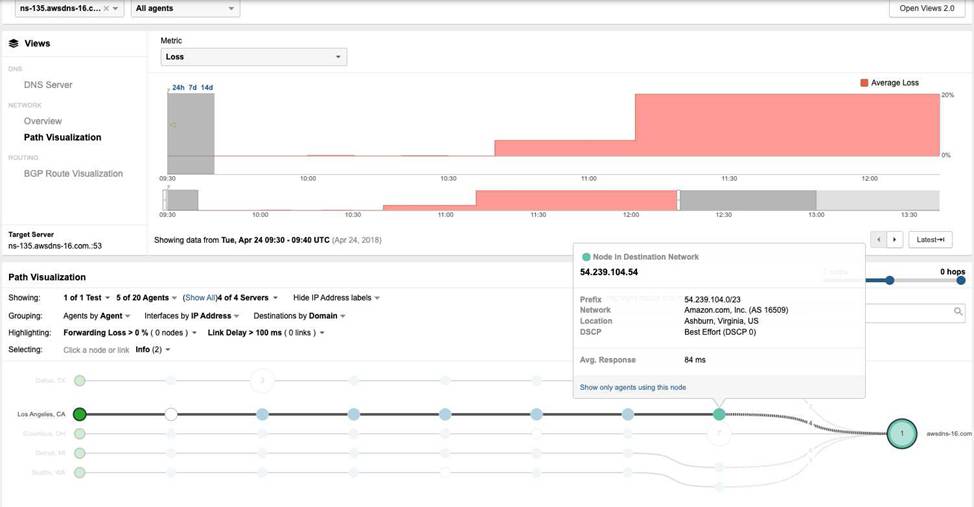
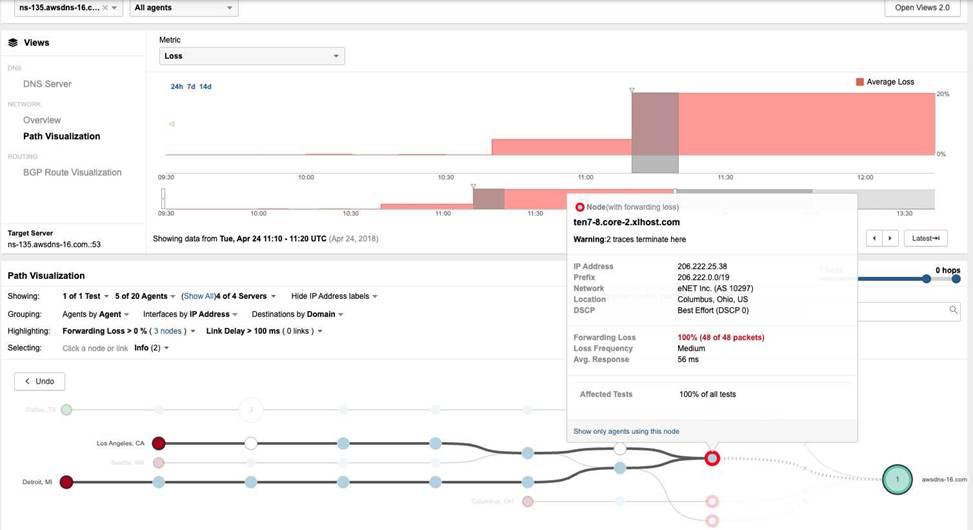
By contrasting Exhibit 3.4-1 (Before the Outage) and Exhibit 3.4-2 (During the Outage), a definitive change in the routing path is observed. In the baseline view (Exhibit 3.4-1), traffic from the Los Angeles agent reaches the destination network 54.239.104.0/23, which is correctly associated with Amazon.com, Inc. (AS 16509). However, during the outage (Exhibit 3.4-2), the path visualization shows the traffic being redirected into a different network: eNET Inc. (AS 10297). At this new location, the traffic encounters 100% Forwarding Loss at the node ten7-8.core-2.xlhost.com.
The change in the Autonomous System (AS) number from 16509 to 10297 (Option B) is the most concrete indicator of a BGP Hijack. While symptoms such as Availability Drop (Option A), Response Delay (Option C), and Packet Loss (Option D) are clearly visible in the Thousand Eyes telemetry, these symptoms are generic and could be caused by various other issues like physical link failures or congestion. The shift in the AS path―specifically to an AS that does not legitimately host the target’s IP prefix―provides the forensic evidence needed to identify the root cause as a routing takeover. This visualization allows network administrators to bypass internal troubleshooting and immediately focus on external remediation with upstream providers.
What type of endpoint agent test will gather browser activity?
- A . Scheduled tests
- B . Dynamic tests
- C . Real user tests
- D . Network Access tests
C
Explanation:
The Designing and Implementing Enterprise Network Assurance (300-445 ENNA) curriculum identifies Real User Tests (RUM) as the primary method for capturing actual browser-based interactions. While synthetic tests provide proactive baselines, Real user tests (Option C) provide visibility into the "lived experience" of an employee as they navigate corporate websites and SaaS platforms.
Real user tests utilize a lightweight browser extension (available for Chrome, Edge, and Safari) that is part of the Endpoint Agent deployment. When a user visits a domain defined in a "Monitored Domain Set," the extension automatically begins recording performance metrics. This includes the time spent on each page, DNS resolution time, and a full browser waterfall of every object (images, scripts, CSS) loaded during the session. Crucially, it calculates an "Experience Score" for each session, allowing IT teams to identify if a user’s frustration is caused by slow page rendering or underlying network issues.
In contrast:
Scheduled tests (Option A) and Dynamic tests (Option B) are forms of Synthetic Monitoring. They simulate traffic using a headless browser or simple network probes to check availability but do not record the actual clicks or browsing activity of the real human user.
Network Access tests (Option D) is not a standard test category in the Thousand Eyes endpoint ecosystem; rather, network connectivity is a layer monitored within the other test types.
Therefore, Real user tests are the definitive tool for organizations needing to analyze actual employee browser behavior and the resulting application performance.
What are the different ways to deploy a Thousand Eyes Agent in a Switch? (Choose all that apply)
- A . Application Hosting
- B . Catalyst Center (formerly DNA Center)
- C . Catalyst SD-WAN Manager (formerly vManage)
- D . From the Thousand Eyes Portal in the "Enterprise & Cloud Agent" section
- E . All of the above
E
Explanation:
In the Designing and Implementing Enterprise Network Assurance (300-445 ENNA) architecture, the deployment of Thousand Eyes Enterprise Agents on switching infrastructure is designed to be highly flexible, catering to different management styles and network scales. Modern Cisco switches, specifically the Catalyst 9300 and 9400 Series, support the execution of containerized applications directly on the switch’s hardware through the Cisco IOS XE Application Hosting framework.1
Application Hosting (Option A) refers to the manual method using the Cisco IOS XE Command Line Interface (CLI). An engineer can use app-hosting commands to install, configure, and manage the Docker-based Enterprise Agent.2 This provides granular control over resource allocation and networking for the container. Catalyst Center (Option B) provides a GUI-driven, automated workflow to deploy agents at scale across an entire campus fabric.3 It simplifies the lifecycle management by handling the installation and activation across multiple switches simultaneously. For switches acting as edge devices in an SD-WAN fabric, Catalyst SD-WAN Manager (Option C) orchestrates the deployment through centralized policies and templates, allowing the agent to be pushed as part of a device configuration. Finally, while the Thousand Eyes Portal (Option D) is the management plane for tests, it is also where the Docker image and Account Group Token are obtained for any of the aforementioned deployment methods.
Each method provides the same end result: an Enterprise Agent running "on-box" to provide deep visibility into the network path starting directly from the access or core layer. Therefore, All of the above (Option E) is the correct answer as it encompasses the manual, automated, and orchestrated methods available for switch-based deployment as per the 300-445 ENNA official guidelines.
The following exhibit shows the Capacity Planning results for a router interface connected to an ISP, which provides a 1Gbps connection.
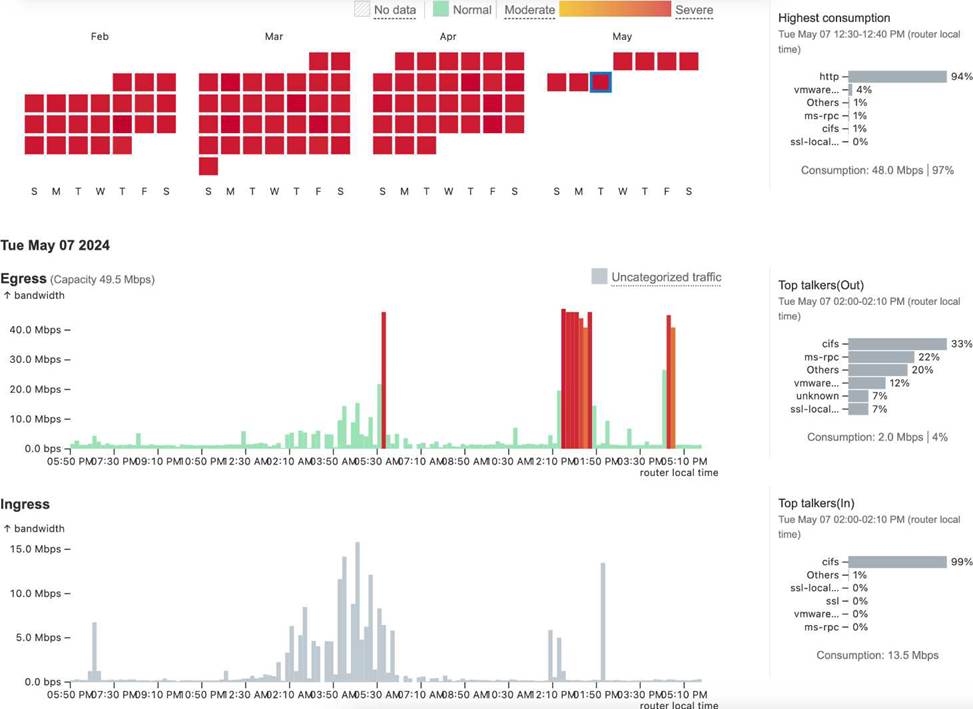
Based on the evidence, which action is most likely to fix the observed behavior?
- A . Request a link increase from the ISP
- B . Reconfigure maximum capacity for the interface
- C . Restrict the Web Sites that can be visited from the site
- D . Reconfigure business hours settings
B
Explanation:
In the context of Designing and Implementing Enterprise Network Assurance (300-445 ENNA), capacity planning requires accurate baselining of interface bandwidth against its theoretical and provisioned limits. Analyzing Exhibit 4.5 Question 4 (image_79d4fc.jpg) reveals a significant discrepancy between the physical reality of the link and its configuration within the monitoring tool.
The exhibit displays a capacity planning dashboard with a calendar heatmap and traffic graphs. The heatmap for February through May shows a high frequency of "Severe" (red) utilization blocks. Looking at the Egress graph for Tue May 07 2024, the traffic spikes clearly exceed 40.0 Mbps. Crucially, the dashboard indicates an "Egress Capacity" of 49.5 Mbps and reports that the "Highest consumption" was 48.0 Mbps, representing 97% of the available bandwidth.
However, the question states that the ISP provides a 1 Gbps (1000 Mbps) connection. Since the actual traffic being sent is less than 50 Mbps, the link is nowhere near physical saturation. The "Severe" alerts and high utilization percentages are occurring only because the monitoring software (likely Thousand Eyes or a similar NMS) is configured with a Maximum Capacity of only 49.5 Mbps for this interface. This misconfiguration causes the tool to calculate utilization based on a much smaller "pipe" than what actually exists, leading to false-positive alerts.
Therefore, the most likely action to fix this observed behavior is to reconfigure maximum capacity for the interface (Option B) to match the 1 Gbps specification.
Option A is unnecessary because the current link is only being utilized at ~5% of its 1 Gbps potential.
Option C is a restrictive policy change that is not justified given the actual available headroom.
Option D might shift how data is displayed but will not fix the underlying mathematical error in utilization calculations.