
Practice Free FCP_FAZ_AN-7.6 Exam Online Questions
Refer to the exhibit.
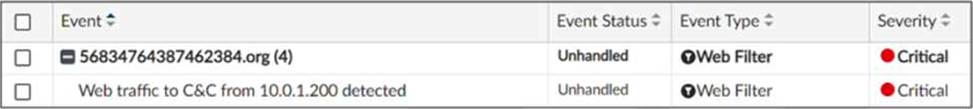
Which statement about the displayed event is correct? (Choose one answer)
- A . An incident was created from this event.
- B . The risk source is isolated.
- C . The security risk was escalated.
- D . The security event risk is considered open.
D
Explanation:
Comprehensive and Detailed Explanation From Exact Extract of knowledge of FortiAnalyzer 7.6 Study guide documents:
In the exhibit, the Event Status shown is Unhandled (Event Type: Web Filter; Severity: Critical). The FortiAnalyzer study guide defines Unhandled events as events whose security risk has not been addressed and is therefore still active/open. Specifically, it states: “Unhandled: The security risk is considered open.”
This directly matches option D.
The other options correspond to different statuses or actions:
Isolated/Contained applies when the risk source is isolated (status Contained), not Unhandled. Escalated refers to events moved/raised for further action (status Escalated), not Unhandled. Whether an incident was created cannot be concluded solely from the status “Unhandled” in the exhibit; the study guide ties incident creation to incident management workflows rather than equating “Unhandled” with an incident being created.
After generating a report, you notice the information you where expecting to see is not included in it.
However, you confirm that the logs are there.
- A . Check the time frame covered by the report.
- B . Disable auto-cache.
- C . Increase the report utilization quota.
- D . Test the dataset
A, D
Explanation:
When a generated report does not contain the expected information even though the logs are confirmed to be present, it typically indicates an issue with the report’s configuration. There are a few common reasons this might happen:
Option A – Check the Time Frame Covered by the Report:
Reports are generated based on a specific time frame. If the report’s time frame does not cover the period when the relevant logs were collected, those logs won’t appear in the report output. Verifying and adjusting the time frame is essential to ensure the report includes all relevant data.
Conclusion: Correct.
Option B – Disable Auto-Cache:
Auto-cache is designed to improve report generation speed by using cached data. Disabling auto-cache would typically only be relevant if the report is pulling outdated data from cache, but it doesn’t directly affect whether specific logs are included in a report.
Conclusion: Incorrect.
Option C – Increase the Report Utilization Quota:
The report utilization quota is related to the resource limits for generating reports. It does not directly influence whether certain data appears in a report. Increasing this quota would help only if there are resource issues preventing the report from completing, not if specific logs are missing from the report.
Conclusion: Incorrect.
Option D – Test the Dataset:
Datasets determine which logs and data fields are pulled into the report. If a dataset is configured incorrectly or does not include the required log fields, it could lead to missing information. Testing the dataset allows you to verify that it’s correctly configured and pulling the expected data.
Conclusion: Correct.
Conclusion:
Correct Answer
Which two actions should an administrator take to vide Compromised Hosts on FortiAnalyzer? (Choose two.)
- A . Enable device detection on the FotiGate device that are sending logs to FortiAnalyzer.
- B . Enable web filtering in firewall policies on FortiGate devices, and make sure these logs are sent to fortiAnalyzer.
- C . Make sure all endpoints are reachable by FortiAnalyzer.
- D . Subscribe FortiAnalyzer to FortiGuard to keep its local threat database up to date.
AB
Explanation:
To view Compromised Hosts on FortiAnalyzer, certain configurations need to be in place on both FortiGate and FortiAnalyzer. Compromised Host data on FortiAnalyzer relies on log information from FortiGate to analyze threats and compromised activities effectively.
Here’s why the selected answers are correct:
Option A: Enable device detection on the FortiGate devices that are sending logs to FortiAnalyzer
Enabling device detection on FortiGate allows it to recognize and log devices within the network, sending critical information about hosts that could be compromised. This is essential because FortiAnalyzer relies on these logs to determine which hosts may be at risk based on suspicious activities observed by FortiGate. This setting enables FortiGate to provide device-level insights, which FortiAnalyzer uses to populate the Compromised Hosts view.
Option B: Enable web filtering in firewall policies on FortiGate devices, and make sure these logs are sent to FortiAnalyzer Web filtering is crucial in identifying potentially compromised hosts since it logs any access to malicious sites or blocked categories. FortiAnalyzer uses these web filter logs to detect suspicious or malicious web activity, which can indicate compromised hosts. By ensuring that FortiGate sends these web filtering logs to FortiAnalyzer, the administrator enables FortiAnalyzer to analyze and identify hosts engaging in risky behavior.
Let’s review the other options for clarity:
Option C: Make sure all endpoints are reachable by FortiAnalyzer
This is incorrect. FortiAnalyzer does not need direct access to all endpoints. Instead, it collects data indirectly from FortiGate logs. FortiGate devices are the ones that interact with endpoints and then forward relevant logs to FortiAnalyzer for analysis.
Option D: Subscribe FortiAnalyzer to FortiGuard to keep its local threat database up to date
Although subscribing to FortiGuard helps keep threat intelligence updated, it is not a requirement specifically to view compromised hosts. FortiAnalyzer primarily uses logs from FortiGate (such as web filtering and device detection) to detect compromised hosts.
Reference: According to FortiOS and FortiAnalyzer documentation, device detection on FortiGate and enabling web filtering logs are both recommended steps for populating the Compromised Hosts view on FortiAnalyzer. These logs provide insights into device behaviors and web activity, which are essential for identifying and tracking potentially compromised hosts.
Which log will generate an event with the status Unhandled?
- A . An AV log with action=quarantine.
- B . An IPS log with action=pass.
- C . A WebFilter log will action=dropped.
- D . An AppControl log with action=blocked.
B
Explanation:
In FortiOS 7.4.1 and FortiAnalyzer 7.4.1, the "Unhandled" status in logs typically signifies that the FortiGate encountered a security event but did not take any specific action to block or alter it. This usually occurs in the context of Intrusion Prevention System (IPS) logs.
IPS logs with action=pass: When the IPS engine inspects traffic and determines that it does not match any known attack signatures or violate any configured policies, it assigns the action "pass". Since no action is taken to block or modify this traffic, the status is logged as "Unhandled."
Let’s look at why the other options are incorrect:
An AV log with action=quarantine: Antivirus (AV) logs with the action "quarantine" indicate that a file was detected as malicious and moved to quarantine. This is a definitive action, so the status wouldn’t be "Unhandled."
A WebFilter log will action=dropped: WebFilter logs with the action "dropped" indicate that web traffic was blocked according to the configured web filtering policies. Again, this is a specific action taken, not an "Unhandled" event.
An AppControl log with action=blocked: Application Control logs with the action "blocked" mean that an application was denied access based on the defined application control rules. This is also a clear action, not "Unhandled."
You are tasked with finding logs corresponding to a suspected attack on your network.
You need to use an interface where all identified threats within timeframe are listed and organized.
You also need to be able to quickly export the information to a PDF file.
Where can you go to accomplish this task?
- A . Log Browse
- B . Log View
- C . Fabric View
- D . FortiView
Exhibit.
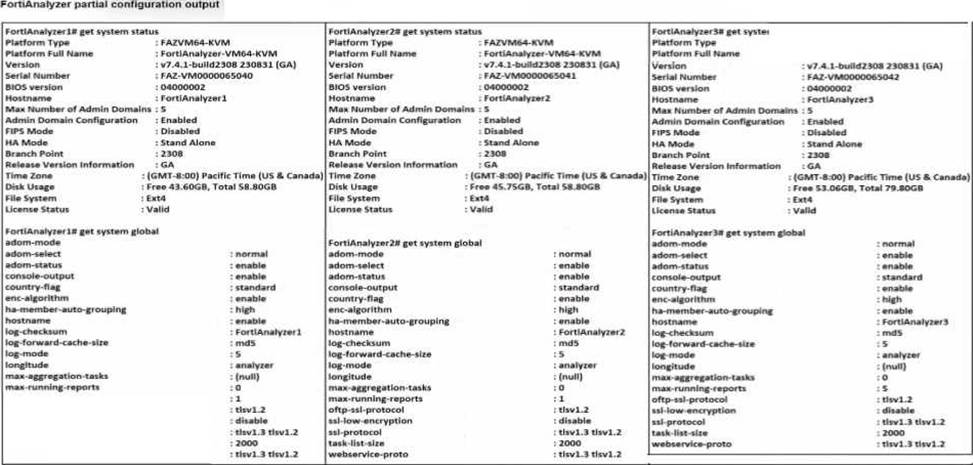
Based on the partial outputs displayed, which devices can be members of a FotiAnalyzer Fabric?
- A . FortiAnalayzer1 and FortiAnalyzer3
- B . FortiAnalyzer1 and FortiAnalyzer2
- C . FortiAnalyzer2 and FortiAnalyzer3
- D . All devices listed can be members.
D
Explanation:
In a FortiAnalyzer Fabric, devices can participate in a cluster or grouping if they meet specific compatibility criteria.
Based on the outputs provided, let’s evaluate these criteria:
Version Compatibility:
All three devices, FortiAnalyzer1, FortiAnalyzer2, and FortiAnalyzer3, are running version v7.4.1-build0238, which is the same across the board. This version alignment is crucial because FortiAnalyzer Fabric requires that devices run compatible firmware versions for seamless communication and management.
Platform Type and Configuration:
All three devices are configured as Standalone in the HA mode, which allows them to operate independently but does not restrict their participation in a FortiAnalyzer Fabric. Each device is also on the FAZVM64-KVM platform type, ensuring hardware compatibility.
Global Settings:
Key settings such as adm-mode, adm-status, and adom-mode are consistent across all devices (adm-mode: normal, adm-status: enable, adom-mode: normal), which aligns with requirements for fabric integration and role assignment flexibility.
Each device also has the log-forward-cache-size set, which is relevant for forwarding logs within a fabric environment.
Based on the above analysis, all devices (FortiAnalyzer1, FortiAnalyzer2, and FortiAnalyzer3) meet the requirements to be part of a FortiAnalyzer Fabric.
Reference: FortiAnalyzer 7.4.1 documentation outlines that devices within a FortiAnalyzer Fabric should be on the same or compatible firmware versions and hardware platforms, and they must be configured for integration. Given that all devices match the version, platform, and mode criteria, they can all be part of the FortiAnalyzer Fabric.
You are trying to configure a task in the playbook editor to run a report.
However, when you try to select the desired playbook, you do to see it listed.
What is the reason?
- A . The report does not have auto-cache and extended log filtering enabled.
- B . The playbook is currently running and will be available after it is finished.
- C . You must create a trigger to run the report first.
- D . The report has no result and must be reconfigured.
Which two statements about local logs on FortiAnalyzer are true? (Choose two.)
- A . They are not supported in FortiView.
- B . You can view playbook logs for all ADOMs in the root ADOM.
- C . Event logs show system-wide information, whereas application logs are ADOM specific.
- D . Event logs are available only in the root ADOM.
BC
Explanation:
FortiAnalyzer manages and stores various types of logs, including local logs, across different ADOMs (Administrative Domains). Each type of log serves specific purposes, with some logs being ADOM-specific and others providing system-wide information.
Option A – Local Logs Not Supported in FortiView:
Local logs are indeed supported in FortiView. FortiView provides visibility and analytics for different log types across the system, including local logs, allowing users to view and analyze data efficiently.
Conclusion: Incorrect.
Option B – Playbook Logs for All ADOMs in the Root ADOM:
FortiAnalyzer allows centralized viewing of playbook logs across all ADOMs from the root ADOM. This feature provides an overarching view of playbook executions, facilitating easier monitoring and management for administrators.
Conclusion: Correct.
Option C – Event Logs vs. Application Logs:
Event Logs provide information about system-wide events, such as login attempts, configuration changes, and other critical activities that impact the overall system. These logs apply across the FortiAnalyzer instance.
Application Logs are more specific to individual ADOMs, capturing details that pertain to ADOM-specific applications and configurations.
Conclusion: Correct.
Option D – Event Logs Only in Root ADOM:
Event logs are available across different ADOMs, not exclusively in the root ADOM. They capture system-wide events, but they can be accessed within specific ADOM contexts as needed.
Conclusion: Incorrect.
Conclusion:
Correct Answer
B. You can view playbook logs for all ADOMs in the root ADOM and
C. Event logs show system-wide information, whereas application logs are ADOM specific.
These answers correctly describe the characteristics and visibility of local logs within FortiAnalyzer.
Reference: FortiAnalyzer 7.4.1 documentation on log types, ADOM configuration, and FortiView functionality.
You discover that a few reports are taking a long tine lo generate.
Which two steps can you Like to troubleshoot? (Choose two.)
- A . Remove old reports from the hcache
- B . Enable auto-cache and run the reports again
- C . Increase the ADOM reports quota
- D . Review report diagnostics
Exhibit.
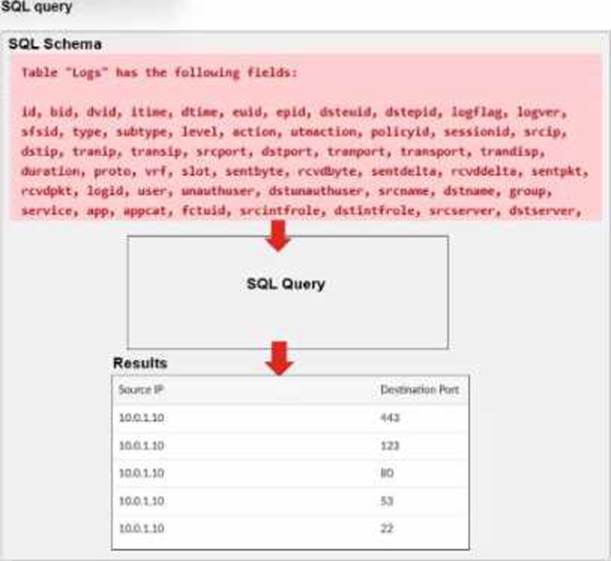
A Forti Analyzer analyst is customizing a SQL query to use in a report.
Which SQL query should the analyst run to get the expected results?
A)
B)
C)
D)
- A . Option A
- B . Option B
- C . Option C
- D . Option D
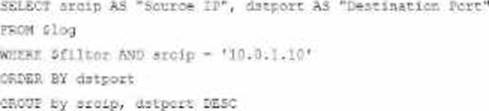
A
Explanation:
The requirement here is to construct a SQL query that retrieves logs with specific fields, namely "Source IP" and "Destination Port," for entries where the source IP address matches 10.0.1.10. The correct syntax is essential for selecting, filtering, ordering, and grouping the results as shown in the expected outcome.
Analysis of the Options:
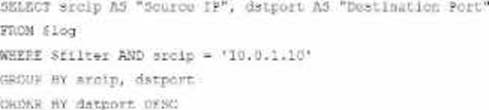
Option A
SELECT srcip AS "Source IP", dstport AS "Destination Port": This syntax selects srcip and dstport, renaming them to "Source IP" and "Destination Port" respectively in the output.
FROM $log: Specifies the log table as the data source.
WHERE $filter AND srcip = ‘10.0.1.10’: This line filters logs to only include entries with srcip equal to 10.0.1.10.
ORDER BY dstport DESC: Orders the results in descending order by dstport.
GROUP BY srcip, dstport: Groups results by srcip and dstport, which is valid SQL syntax.
This option meets all the requirements to get the expected results accurately.
Option B
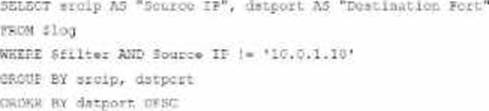
WHERE $filter AND Source IP != ‘10.0.1.10’: Uses != instead of =. This would exclude logs from the specified IP 10.0.1.10, which is contrary to the expected result.
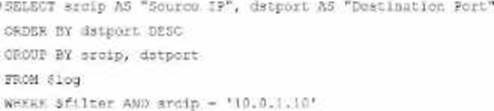
Option C
The ORDER BY clause appears before the FROM clause, which is incorrect syntax. SQL requires the FROM clause to follow the SELECT clause directly.
Option D
The GROUP BY clause should follow the FROM clause. However, here, it’s located after WHERE, making it syntactically incorrect.
Conclusion:
Correct Answer