
Practice Free PL-300 Exam Online Questions
HOTSPOT
You have a report page that contains the visuals shown in the following exhibit.
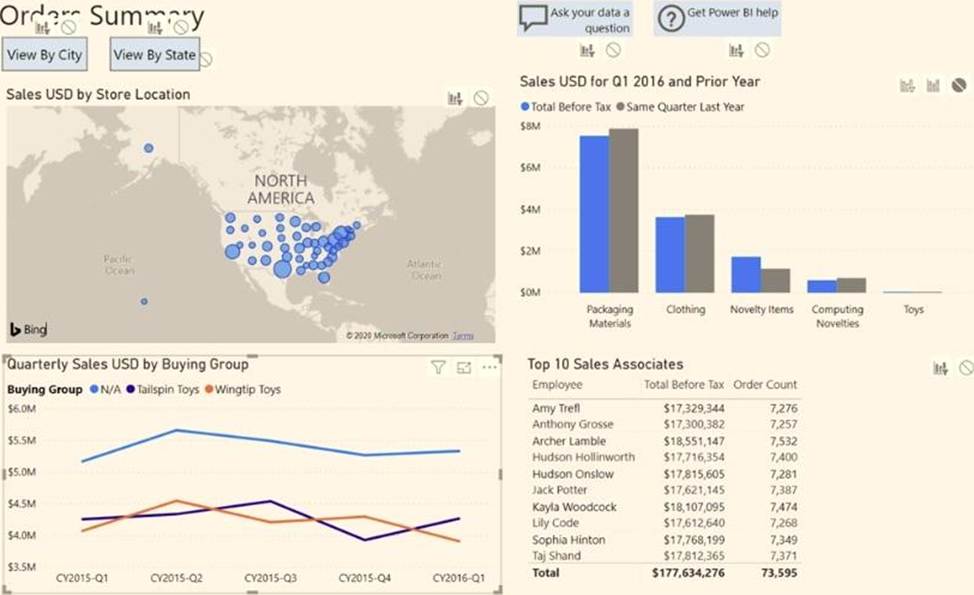
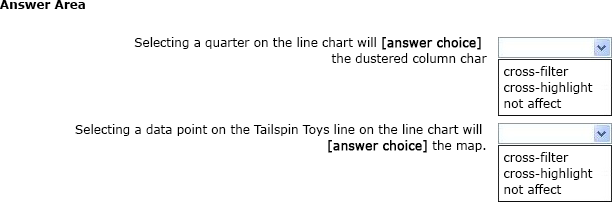
Use the drop-down menus to select the answer choice that completes each statement based on the information presented in the graphic. NOTE: Each correct selection is worth one point.
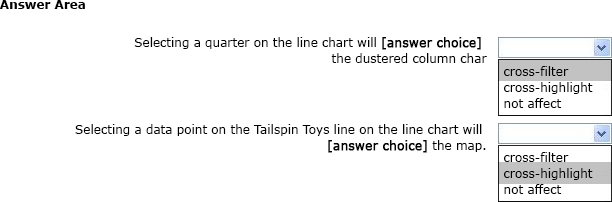
Explanation:
Box 1: cross-filter
By default, selecting a data point in one visual on a report page will cross-filter or cross-highlight the other visuals on the page.
Box 2: cross-highlight
Example:
By default, selecting a data point in one visual on a report page will cross-filter or cross-highlight the other visuals on the page.
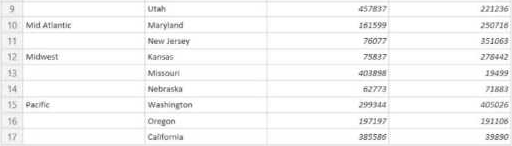
You have the CSV file shown in the following table.
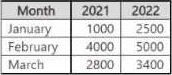
You use Power Query Editor to preview the data in the file.
You need to transform the data to meet the following requirements:
• The first column must contain the month.
• The second column must contain the year.
• The third column must contain the order amount for the month and year.
Which transformation should you use first?
- A . unpivot
- B . pivot
- C . transpose
- D . remove
Note: This question is part of a series of questions that present the same scenario. Each question in the series contains a unique solution that might meet the stated goals. Some question sets might have more than one correct solution, while others might not have a correct solution.
After you answer a question in this section, you will NOT be able to return to it. As a result, these questions will not appear in the review screen.
From Power Query Editor, you profile the data shown in the following exhibit.
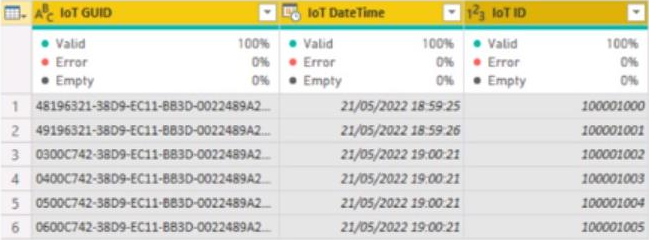
The IOT ID columns are unique to each row in query.
You need to analyze 10T events by the hour and day of the year. The solution must improve dataset performance.
Solution: You change the IOT DateTime column to the Date data type.
Does this meet the goal?
- A . Yes
- B . No
Which DAX expression should you use to get the ending balances in the balance sheet reports?
- A . CALCULATE (
SUM( BalanceSheet [BalanceAmount] ),
DATESQTD( ‘Date'[Date] )
) - B . CALCULATE (
SUM( BalanceSheet [BalanceAmount] ),
LASTDATE( ‘Date'[Date] )
) - C . FIRSTNONBLANK ( ‘Date’ [Date]
SUM( BalanceSheet[BalanceAmount] )
) - D . CALCULATE (
MAX( BalanceSheet[BalanceAmount] ),
LASTDATE( ‘Date’ [Date] )
)
A
Explanation:
Scenario: At least one of the balance sheet reports in the quarterly reporting package must show the ending balances for the quarter, as well as for the previous quarter.
DATESQTD returns a table that contains a column of the dates for the quarter to date, in the current context.
Reference: https://docs.microsoft.com/en-us/dax/datesqtd-function-dax
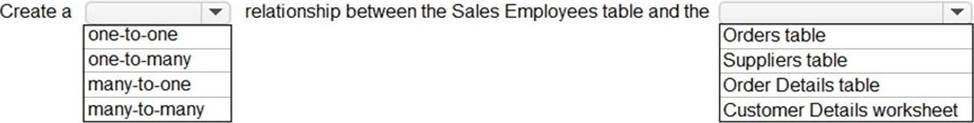
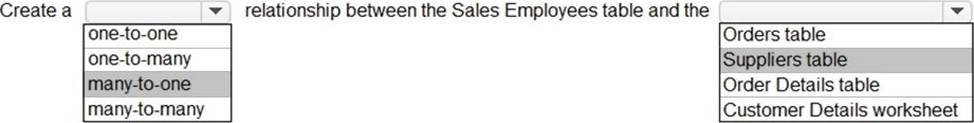
HOTSPOT
You need to create a relationship in the dataset for RLS.
What should you do? To answer, select the appropriate options in the answer area. NOTE: Each correct selection is worth one point.
Explanation:
Box 1: many-to-one
Each employee in the Sales Employees table is assigned to one sales region. Multiple employees can be assigned to each region.
The Suppliers table has a Region column.
Box 2: Suppliers table
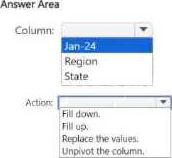
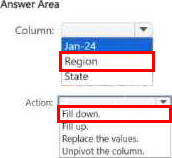
HOTSPOT
Each Region value appears only on the tow where it first occurred. Each subsequent occurrence of the Region value is blank.
You need to ensure that every row contains the connect non-blank value The solution must minimize development effort.
Which column should you select, and which action should you perform on the column? To answer, select the appropriate options in the answer area. NOTE; Each connect selection is worth one point.
You have a source that contains a comumn. The column contains case sensitive date. You have a Power BI semantic model in DirectQuery mode. You connect to the model and discover that it contains undefined values and errors. You need to resolve the issue.
Solution: You add an index key and normalize casing in the data source.
Does this meet the goal?
- A . Yes
- B . No
A
Explanation:
Adding an index key and normalizing casing in the data source would help resolve issues with undefined values and errors in a case-sensitive column. The index key can provide a unique identifier, and normalizing casing ensures consistency in the data, which would likely prevent the errors you encountered in the Power BI semantic model.
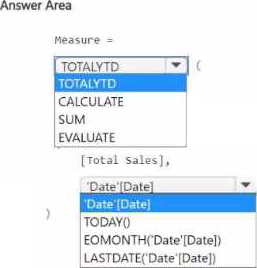
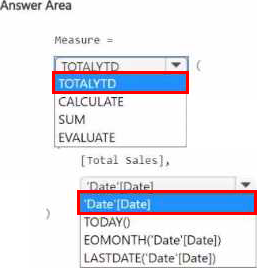
You have a Power Bl report that contains a measure named Total Sales.
You need to create a new measure that will return the sum of Total Sates for a year up to a selected date.
How should you complete the DAX expression? To answer, select the appropriate options in the answer area. NOTE: Each correct selection is worth one point.
HOTSPOT
You have a report in Power BI Desktop.
You add a key influencers visual as shown in the exhibit. (Click the Exhibit tab.)
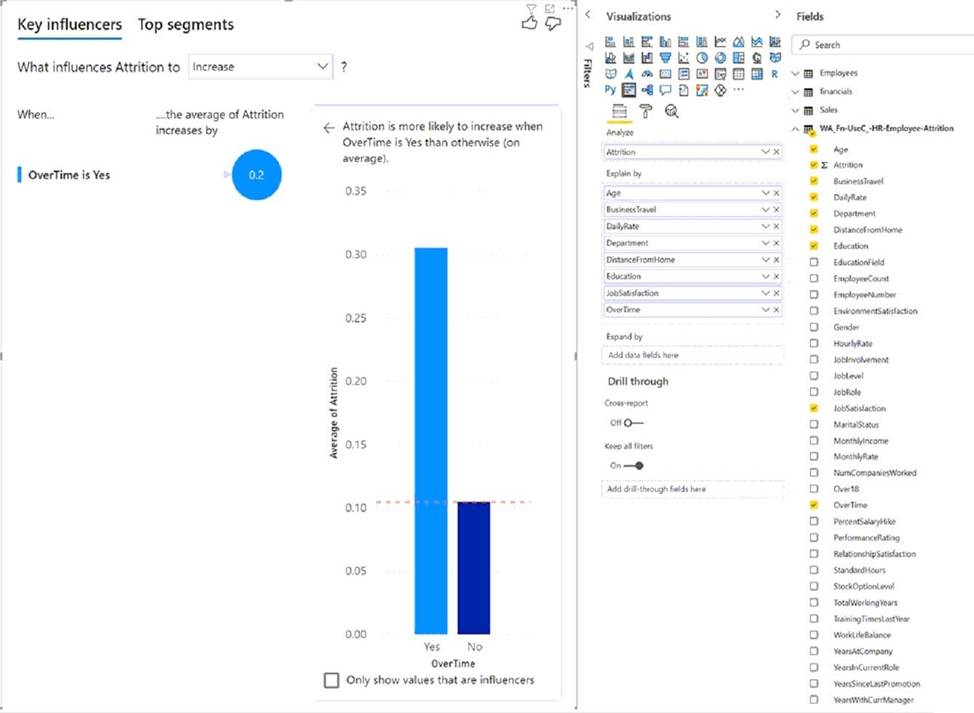
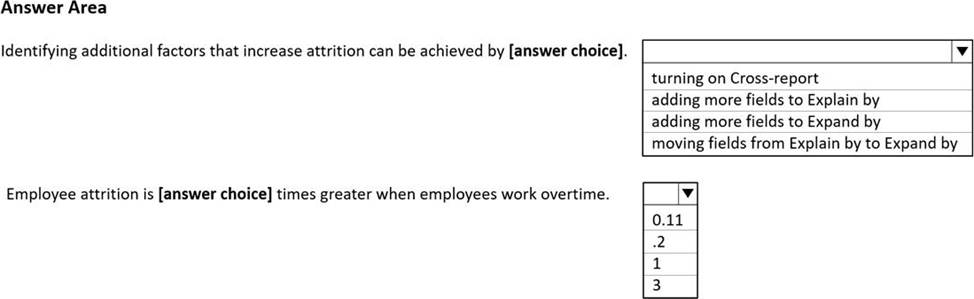
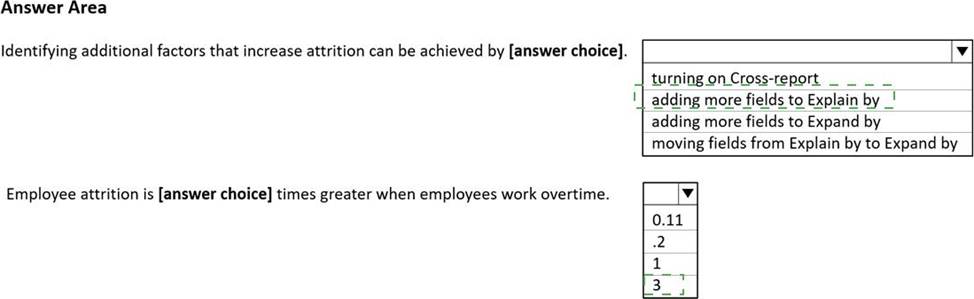
Use the drop-down menus to select the answer choice that completes each statement based on the information presented in the graphic. NOTE: Each correct selection is worth one point.
Explanation:
– adding more fields to Explain By
– 3
https://learn.microsoft.com/en-us/power-bi/visuals/power-bi-visualization-influencers?tabs=powerbi-desktop
You need to recommend a strategy to consistently define the business unit, department, and product category data and make the data usable across reports.
What should you recommend?
- A . Create a shared dataset for each standardized entity.
- B . Create dataflows for the standardized data and make the dataflows available for use in all imported datasets.
- C . For every report, create and use a single shared dataset that contains the standardized data.
- D . For the three entities, create exports of the data from the Power Bl model to Excel and store the data in Microsoft OneDrive for others to use as a source.