
Practice Free 300-445 Exam Online Questions
Refer to the exhibit.
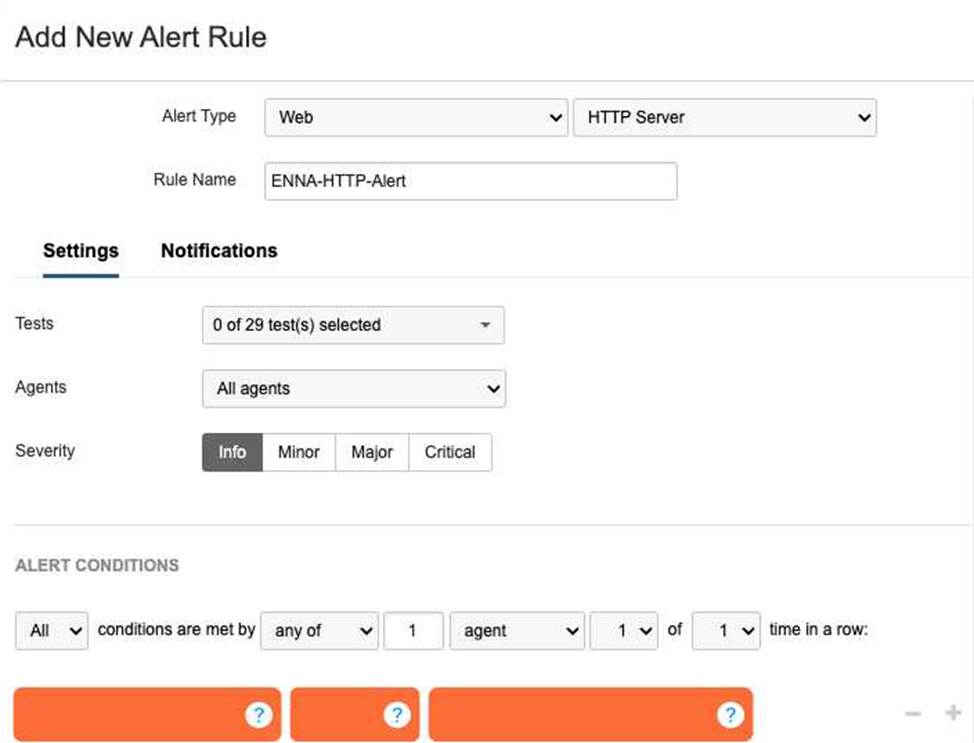
A network engineer is tasked with configuring an alert that will trigger if the HTTP server responds with a server error.
What alert conditions should be configured to meet the specified requirements?
- A . Error type is any
- B . Wait Time is Dynamic (New) with Medium sensitivity
- C . Response Time ≥ Static 500ms
- D . Response Code is server error(5XX)12
D34
Explanation:
56
In the Designing and Implement7ing Enterpr8ise Network Assurance (300-445 ENNA) framework, configuring effective alert rules is critical for distinguishing between standard network noise and actionable application-layer failures. For Web – HTTP Server tests, Thousand Eyes allows engineers to monitor both network-level metrics (like Connect time) and application-level indicators (like HTTP response codes).
The requirement is to trigger an alert specifically when the HTTP server responds with a server error. In the HTTP protocol, server errors are categorized as the 5XX series of status codes (e.g., 500 Internal Server Error, 503 Service Unavailable, 504 Gateway Timeout). To meet this requirement, the engineer must configure a location alert condition where the Metric is set to Response Code and the condition value is server error(5XX) (Option D).
Reviewing the other options:
Error type is any (Option A): While this would capture server errors, it would also trigger for 4XX client errors (like 404 Not Found) and network-layer timeouts, making it too broad for a specific "server error" requirement.
Wait Time is Dynamic (Option B): This monitors the time-to-first-byte using statistical baselining. While high wait times often precede 5XX errors, this condition only alerts on latency, not on the actual error code itself.
Response Time (Option C): Similar to wait time, this monitors performance speed rather than the logical success or failure of the server’s response.
By specifically selecting Response Code: server error(5XX), the engineer ensures that the operations team is only notified when the application backend is experiencing a functional failure, rather than just a slow response or a client-side misconfiguration.
A network monitoring engineer is tasked with creating a widget that displays the average packet loss from an agent installed as a Linux package.
What is the data source and measure that should be selected?
- A . Endpoint Agents and Median
- B . Cloud & Enterprise Agents and Mean
- C . Routing and Standard Deviation
- D . Devices and nth Percentile
B
Explanation:
In Designing and Implementing Enterprise Network Assurance (300-445 ENNA), dashboard widgets must be mapped to the correct telemetry data source and statistical measure. When an agent is installed as a Linux package on an organization’s infrastructure, it is classified as an Enterprise Agent.
The correct configuration for this widget is Cloud & Enterprise Agents and Mean (Option B).
Data Source: Since the Linux-based agent is an Enterprise Agent, it shares the same data source category as Cloud Agents in the Thousand Eyes dashboard configuration menu.
Measure: To display the "average" packet loss as requested, the Mean (the arithmetic average) is the appropriate statistical measure.
Other options are unsuitable:
Option A: Endpoint Agents are those installed on Windows/macOS user devices, not typically a standard Linux server package used for infrastructure monitoring. Median would show the middle value, not the average.
Option C: Routing refers to BGP data, which does not report packet loss in the same way as synthetic network tests.
Option D: Devices refers to hardware monitored via SNMP, and an nth Percentile is a specific statistical cutoff (like 95th percentile) rather than a simple average.
A company is noticing sporadic slowdowns in their web application performance, impacting user experience. They suspect it might be related to high CPU utilization on employee laptops, potentially caused by background processes.
Which Thousand Eyes alert type and condition combination would be most effective in identifying if endpoint CPU performance is contributing to this issue?
- A . Real User Tests > Network Tests and Path Trace, End-to-End Packet Loss
- B . Scheduled Tests > Endpoint Path Trace, Path length > #
- C . Real User Tests > Endpoint, CPU utilization ≥ %
- D . Scheduled Tests > Endpoint End-to-End (server), Memory load ≥ %
C
Explanation:
In the Designing and Implementing Enterprise Network Assurance (300-445 ENNA) curriculum, isolating performance issues on end-user machines requires a combination of application-layer experience data and local system telemetry. When an architect suspects that local hardware constraints, such as high CPU usage, are degrading the digital experience, the Endpoint Agent is the required vantage point.
The correct combination is Real User Tests > Endpoint, CPU utilization ≥ % (Option C).
This alert configuration is effective for several reasons:
Targeted Visibility: It directly monitors the user’s device (Endpoint) where the hardware bottleneck is suspected to reside.
Real-Time Context: By utilizing Real User Tests (RUM), the agent gathers performance data during actual user activity (e.g., browsing the web application). This ensures that the CPU spikes are correlated with active application usage, providing a representative view of the impact on experience.
Threshold Alerting: The condition monitors for CPU utilization exceeding a defined percentage threshold (≥ %). This allows IT teams to be notified only when the CPU load reaches problematic levels that are known to cause application sluggishness or browser "freezing".
Alternative options are less effective for this specific troubleshooting goal:
Option A: Monitors network loss, which would not identify a local CPU bottleneck.
Option B: Monitors path length (hops), which is a routing metric irrelevant to local hardware performance.
Option D: Monitors memory load during scheduled tests. While memory is a factor, the specific suspicion in this scenario is CPU utilization, and scheduled tests do not always capture the same load impact as a real user interacting with the browser.
What advantage does the integration of Thousand Eyes with Cisco technologies offer for troubleshooting?
- A . It eliminates the need for manual data entry.
- B . It provides real-time virtual assistance to end-users.
- C . It automates network configuration changes based on user feedback.
- D . It allows for quick identification and resolution of performance issues.11
D
Explanation:
The Designing and Implementing Enterprise Network Assurance (300-445 ENNA) certification emphasizes that the primary value proposition of the Cisco "Assurance Stack" is the reduction of Mean Time to Identification (MTTI) and Mean Time to Resolution (MTTR). The integration of Thousand Eyes across Cisco’s portfolio―including Catalyst, Meraki, and SD-WAN―allows for quick identification and resolution of performance issues (Option D).12
By embedding Thousand Eyes agents into the existing network infrastructure, Cisco enables "end-to-end visibility" that spans domains the enterprise traditionally does not control, such as the public internet and SaaS environments.13 During troubleshooting, this cross-platform visibility allows network engineers to immediately correlate internal network health (from Catalyst Center or Meraki Dashboard) with external path visualization (from Thousand Eyes). For example, when a user experiences poor video quality in a Webex meeting, the integration allows the engineer to "cross-launch" from the Webex Control Hub directly into a Thousand Eyes path view.14 This pinpoint accuracy avoids the "blame game" between network, application, and ISP teams by providing a "single source of truth" regarding where the packet loss or latency is occurring.
While some automation exists (Option C), the core benefit isn’t automatic configuration changes based on feedback, but rather providing the actionable insights required for manual or policy-based remediation. Similarly, while it streamlines data gathering, its ultimate purpose is the speed of resolution in complex, hybrid environments.
Considering the observed network behavior and the information in the exhibits, which action would be the most appropriate next step for the network administrator to take?
- A . Contact the internal network team to investigate potential misconfigurations on the local routers
- B . Reach out to the Internet Service Provider (ISP) to report the suspected BGP hijacking incident
- C . Implement traffic filtering rules on the firewall to block traffic originating from AS 10297
- D . Restart the DNS server to refresh its cache and potentially resolve the observed issue
B
Explanation:
The Designing and Implementing Enterprise Network Assurance (300-445 ENNA) framework emphasizes that the goal of internet intelligence is to enable rapid and accurate escalation to the party responsible for a service degradation. Based on the evidence of a BGP Hijack identified in the previous question, the issue is occurring entirely within the public internet ecosystem.
The most appropriate next step is to reach out to the Internet Service Provider (ISP) to report the suspected BGP hijacking incident (Option B). Since the traffic is being misdirected by an external Autonomous System (AS 10297) before it reaches the intended destination (AS 16509), the fix must occur at the routing policy level of the major transit providers. The network administrator should provide the ISP with the Thousand Eyes "Share Link" or screenshots showing the path change and the unauthorized AS announcement, as this data serves as proof to accelerate the ISP’s mitigation efforts, such as implementing prefix filters or contacting the offending network.
Other options are ineffective for this specific scenario:
Option A: The path visualization shows that traffic is successfully leaving the local network and reaching the public internet; the problem is many hops away from the internal routers.
Option C: Blocking traffic from AS 10297 does not solve the problem of your traffic being attracted to it. The hijack affects how the rest of the world (including your ISP) sees the route to your destination.
Option D: DNS is not the issue; the agent successfully resolved the hostname to the correct IP, but the BGP layer misdirected the packets at the routing level.
By identifying the issue as an external routing event, the administrator avoids wasting internal resources and directly triggers the necessary external remediation.
An administrator has set up GPO properly, but realized Thousand Eyes EPA was not deployed on one of the office PCs.9.
What is the appropriate first step?
- A . After GPO deployment, an administrator account must log in to deploy the EPA
- B . Check that the PC belongs to the needed domain
- C . Reboot the PC, this will restart GPO on the server
- D . Reboot the Server, this will restart GPO on the PC
B
Explanation:
In the Designing and Implementing Enterprise Network Assurance (300-445 ENNA) curriculum, troubleshooting deployment issues is as critical as the initial configuration. When utilizing Group Policy Objects (GPOs) for the distribution of the Thousand Eyes Endpoint Agent (EPA), certain prerequisites must be met for the policy to take effect on a target machine.10
The most fundamental requirement is that the target PC must be a member of the domain or the specific Organizational Unit (OU) where the GPO is linked. Therefore, the appropriate first step is to check that the PC belongs to the needed domain (Option B). GPOs are scoped based on Active Directory membership; if a computer is in a workgroup or a different domain/OU that is not targeted by the policy, it will never receive the instruction to install the software, regardless of how "properly" the GPO is configured on the server.11
The other options are technically incorrect or represent a misunderstanding of GPO mechanics:
Administrator Login (Option A): EPA installation via GPO is typically configured to run under the System account context during startup, meaning it is not dependent on a specific user (administrator or otherwise) logging in to trigger the deployment.
Rebooting to restart GPO on the server (Option C): Rebooting a client PC triggers a "GPUpdate" request from the client to the server, but it does not "restart" the GPO service on the server side.
Rebooting the Server (Option D): This is an invasive and unnecessary step that will not force a policy update on a specific client PC if that PC is not correctly joined to the domain or is experiencing a local networking issue.
By verifying domain membership first, the administrator ensures the basic trust and communication path required for GPO delivery is functional before moving to more complex troubleshooting steps like checking event logs or network connectivity.
You want to monitor Microsoft Teams using Thousand Eyes endpoint agents.
Which tests are available for this type of application monitoring?
- A . Scheduled tests
- B . Dynamic tests
- C . Scheduled, dynamic and real user tests
- D . Scheduled and dynamic tests
D
Explanation:
According to the Designing and Implementing Enterprise Network Assurance (300-445 ENNA) best practices for collaboration monitoring, Microsoft Teams (as well as Webex and Zoom) is monitored using a combination of Scheduled and Dynamic tests (Option D).
Scheduled Tests: These are used to proactively monitor the reachability and performance of the Microsoft Teams infrastructure. The Teams template typically includes scheduled HTTP Server tests to teams.microsoft.com and login.microsoftonline.com, along with network-layer tests to the Teams Transport Relay (e.g., worldaz.tr.teams.microsoft.com). These provide a continuous baseline of connectivity regardless of whether a user is currently in a call.
Dynamic Tests: These are a unique feature for collaboration monitoring. When an Endpoint Agent detects that the Teams application has initiated a real-time media session (audio or video call), it automatically triggers a Dynamic Test to the specific IP and port being used for that call. This allows IT teams to see the exact network path―including hop-by-hop latency and loss―of the actual call traffic while the session is active.
Real User Tests (Option C) are generally not used for Teams monitoring in the same way they are for web-based SaaS apps. Because most users utilize the Teams desktop client rather than the browser, the RUM browser extension cannot capture the rich telemetry of the desktop application’s internal signaling and media streams. Therefore, the specialized "Automated Session Testing" provided by Dynamic Tests, combined with the proactive health checks of Scheduled Tests, constitutes the complete assurance strategy for Microsoft Teams.
Which of the following is an example of active monitoring in network performance management?
- A . Analyzing SNMP data to observe interface utilization on a router
- B . Capturing packets on a network segment to identify the top talkers
- C . Sending a continuous ping from one office to another to measure latency
- D . Collecting NetFlow records to analyze traffic patterns over time
C
Explanation:
Within the framework of Designing and Implementing Enterprise Network Assurance (300-445 ENNA), network monitoring is categorized into two primary methodologies: active and passive monitoring.1 Active monitoring (Option C) is characterized by the generation of synthetic or "probes" traffic specifically designed to measure network performance.2 These probes simulate real-world user activity, such as HTTP requests, DNS queries, or ICMP pings, to baseline performance metrics like latency, jitter, and packet loss.
The core benefit of the active approach is its independence from actual user traffic. By sending a continuous ping or synthetic HTTP probe, an engineer can verify path availability and performance even during off-peak hours when no real users are on the network. In the context of Cisco Thousand Eyes―a central platform in the ENNA certification―this is the primary mode of operation for Cloud, Enterprise, and Endpoint agents. For instance, a Thousand Eyes network test proactively sends packets to a target IP or URL to visualize the hop-by-hop underlay and overlay paths.
Conversely, options A, B, and D represent passive monitoring techniques. Passive monitoring involves observing and analyzing traffic that is already traversing the network.3 Methods such as SNMP (Option A) provide device-level health data like CPU load and interface utilization, while packet captures (Option B) and NetFlow (Option D) analyze the characteristics of existing user flows to determine top talkers or traffic patterns. While passive monitoring is excellent for volume and utilization analysis, it lacks the proactive capability to test a path’s performance before a user encounters a failure. Therefore, sending a synthetic probe like a continuous ping is the definitive example of active monitoring.
A CPU utilization alert for Endpoint Agents is triggering too frequently, creating alert noise.
Which of the following steps would help reduce the sensitivity of the alert rule? (Select two)
- A . Increase the number of agents that must exceed the CPU threshold to trigger the alert
- B . Lower the CPU utilization percentage in the alert condition
- C . Adjust the alert rule to require more rounds of data to exceed the threshold
- D . Enable the alert rule on more Endpoint Agents
A, C
Explanation:
Alert fatigue is a major operational challenge in network assurance. To make a CPU utilization alert for Endpoint Agents less sensitive and reduce "noise," an engineer must implement statistical filters that ignore transient spikes or isolated events.
The two most effective methods are:
Increase the agent count (Option A): By requiring a higher number or percentage of agents to simultaneously exceed the threshold, the system ensures the alert represents a widespread environmental issue rather than a single user running a CPU-intensive background process.
Require more rounds of data (Option C): Instead of alerting on a single measurement (1 of 1 round), the engineer can configure the rule to require the threshold to be breached for multiple consecutive checks (e.g., 2 of 3 rounds). This filters out brief, non-impactful CPU spikes that occur naturally during OS updates or browser startups.
Other options would have the opposite effect:
Option B: Lowering the percentage threshold (e.g., from 90% to 50%) would cause the alert to trigger much more frequently, increasing noise.
Option D: Enabling the alert on more agents increases the pool of potential triggers, which typically leads to more notifications unless the logic in Option A is also applied.
In the IT operations dashboard, what is the alert trigger reason?
- A . Page Load Packet Loss
- B . Network jitter
- C . Network packet loss
- D . Page Load Latency
C
Explanation:
The IT Operations Dashboard includes a section at the beginning that explicitly displays active alert rules and their status. According to the dashboard configuration, the reason for the current alert trigger is Network packet loss. This indicates that the underlying network path for the application is experiencing packet drops exceeding the defined threshold, even if the application layer remains partially functional.